Overview
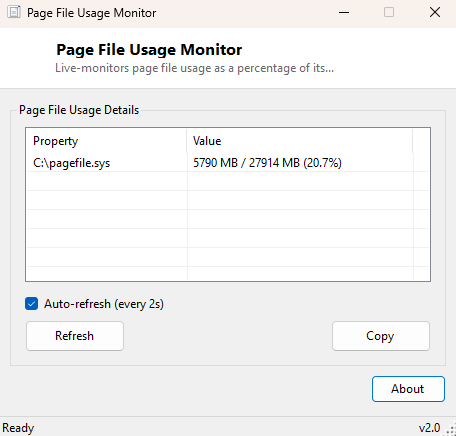
Page File Usage Monitor watches how full your configured page file is running, as a live percentage, updating continuously rather than as a one-time snapshot. Where Memory Page File Viewer answers "what is configured and what is the current number," this tool answers the more dynamic question of "is that number climbing right now, and how close is it to the ceiling" — useful precisely because page file usage can spike suddenly under memory pressure and then settle back down just as quickly, a pattern a single static reading would completely miss.
It is deliberately narrow in scope, watching only the page file rather than trying to be a general-purpose memory dashboard — for the broader picture of physical RAM alongside page file behavior together, pairing this tool with RAM Usage Monitor running side by side gives a genuinely complete live view of a system's total memory situation without needing a heavier all-in-one monitoring suite.
Key Features
- Live page file usage percentage, updated every two seconds
- Shows current usage against the allocated maximum for context
- Handles multiple configured page files simultaneously
- Auto-refresh toggle to pause monitoring when not needed
- Lightweight enough to leave running continuously without noticeable overhead
Why You Might Need This Tool
Page file usage climbing rapidly under sustained load — during a large batch render, a big compile, or several memory-heavy applications running at once — is one of the clearest early signs that a system is genuinely running short on physical RAM and is starting to rely on disk-backed virtual memory to compensate, which is dramatically slower than RAM even on a fast SSD. Watching this number climb and fall in real time during a specific workload is far more informative than a single after-the-fact reading, since it tells you exactly which activity triggered the spike and whether the system recovered cleanly once that activity finished.
How It Works
On each refresh, the tool queries Win32_PageFileUsage via WMI for
CurrentUsage and AllocatedBaseSize, both in megabytes, and
calculates the percentage directly from those two figures for each configured page
file. Because Win32_PageFileUsage reflects live Windows-maintained
counters rather than a cached value, the numbers update meaningfully between
consecutive two-second polls whenever real memory pressure is occurring, giving a
genuinely live view rather than a slowly-refreshing approximation.
How to Use It
Open the tool before starting a memory-intensive task and watch the percentage during and after. A brief spike that settles back down once the task completes is normal, healthy virtual-memory behavior; a percentage that stays pinned near 100% even during ordinary use is a stronger sign that either more physical RAM or a larger page file (via Large Page File Creator) would genuinely help. Toggle the auto-refresh checkbox off if you want to freeze the display at a particular moment — useful for taking a screenshot of a spike to include in a bug report or a support request, without the number changing under you mid-capture.
System Requirements & Notes
Runs on 64-bit Windows 10 and 11 and requires no administrator rights, since reading page file usage statistics through WMI is a standard-user operation. It works correctly whether the system has one page file, several spread across multiple drives, or a system-managed page file that Windows resizes automatically in the background.
Frequently Asked Questions
Is high page file usage always a problem?
Not necessarily — Windows uses the page file proactively even when physical RAM is
not under severe pressure, as part of normal memory management. Sustained usage
consistently near the maximum during everyday tasks is the pattern worth acting on.
Does closing this monitor affect page file behavior?
No — it only observes existing Windows counters and has no influence on how the page
file itself is actually used.
Why does usage sometimes drop suddenly rather than tapering off?
Windows can reclaim page file space once memory pressure eases and the pages it was
holding are no longer needed, which can look like a sharp drop on this monitor rather
than a gradual decline — that behavior is normal, healthy memory management rather
than anything to be concerned about.