Overview
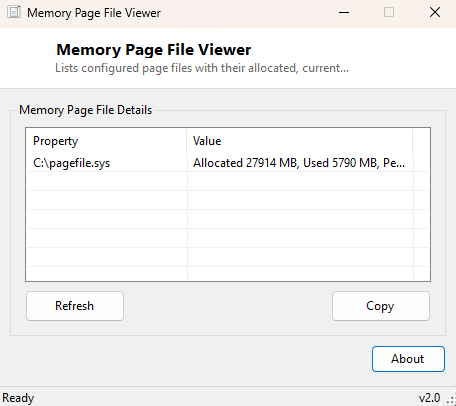
Memory Page File Viewer lists every page file currently configured on the system — which is not always just one — along with its allocated size, how much of that allocation is currently in use, and the peak usage recorded since the last reboot. Windows can be configured with a page file per drive, a single system-managed file, or no page file at all in unusual setups, and none of that configuration is visible anywhere in the standard Settings app without navigating through several nested dialogs under System Properties. This tool surfaces exactly that configuration in one flat, readable list.
Page files themselves are one of the more quietly misunderstood parts of Windows — many users assume there is exactly one, sized automatically, and never think about it again, right up until a low-disk-space warning or a performance problem forces the question. Others have manually tuned page file placement and size years ago on an old machine and then cloned that configuration onto every system since, without ever checking whether it still makes sense on newer hardware with different drive layouts and far more installed RAM. This tool exists to make checking that configuration trivially easy, whichever category you fall into.
Key Features
- Lists every configured page file by name and location
- Shows allocated base size for each page file
- Shows current usage and peak usage recorded since boot
- Clearly reports when no page file is configured
- Read-only — makes no changes to page file configuration
Why You Might Need This Tool
This tool is most useful as a diagnostic first step before making any page file change — confirming exactly what is configured right now, on which drive, and how close current usage is running to the allocated maximum, before deciding whether a resize is actually warranted. It is also useful after moving a page file to a different drive (commonly done to put it on a faster SSD, or off a smaller boot drive that is running low on space) to confirm the change actually took effect exactly as intended rather than trusting the Settings dialog blindly. Peak usage in particular is a number worth checking periodically, since it reveals a system's worst-case memory pressure moment even if things look calm right now.
How It Works
The tool queries Win32_PageFileUsage via WMI, which exposes exactly the
fields this page displays — name, allocated base size, current usage and peak usage,
all reported in megabytes directly by Windows rather than calculated. If the query
returns no results, the tool explicitly reports that no page file is currently
configured (or that one is configured but has not been used at all since boot,
which is possible with a very large system-managed file on a machine with abundant
physical RAM) rather than showing a confusing blank table.
How to Use It
Open the tool to see an immediate, one-time snapshot — since page file configuration changes rarely and only through a deliberate action, this is a static viewer rather than a live monitor. If you want to watch usage change over time, see Page File Usage Monitor instead, and to change page file size see Large Page File Creator. Refreshing the view after making a change confirms the new configuration took effect exactly as intended before you close the settings dialog and move on.
System Requirements & Notes
Runs on 64-bit Windows 10 and 11, no administrator rights required to view current page file configuration and usage statistics.
Frequently Asked Questions
Why do I see more than one page file listed?
Windows allows a separate page file per drive; some configurations, particularly on
systems with multiple fast drives, deliberately spread page file space across more
than one to balance I/O load.
Can I resize a page file from this tool?
No — this is a read-only viewer. Use Large
Page File Creator to create or resize a page file on any fixed drive.
What does it mean if peak usage is much higher than current usage?
It means the system experienced heavier memory pressure at some point since the last
reboot than it is under right now — worth investigating what was running at the time
if that peak is close to the allocated maximum, since it hints at a recurring
workload that could benefit from more RAM or a larger page file.