Overview
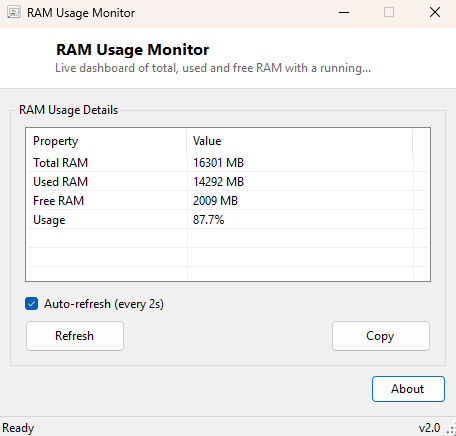
RAM Usage Monitor is a small, always-legible dashboard showing exactly how much physical memory your system has, how much is currently in use, how much is free, and the used-memory percentage — four numbers that Task Manager technically shows too, but scattered across graphs and tooltips rather than laid out plainly in one compact window you can keep open in a corner of the screen while you work. It updates automatically on a timer, so it functions as a lightweight, always-on memory gauge rather than something you have to remember to refresh.
Unlike Task Manager's memory graph, which blends several different Windows memory accounting concepts together, this tool reports the two numbers that answer the question people actually ask — "how much RAM is free right now" — without also trying to explain cached, standby, or modified memory pages, which is genuinely useful detail for kernel engineers but mostly noise for everyday troubleshooting.
Key Features
- Shows total installed physical memory in megabytes
- Shows currently used memory and currently free memory as separate figures
- Calculates and displays a live used-memory percentage
- Auto-refreshing with a configurable live-update timer
- One-click Copy button to paste the current snapshot as text
- Tiny, unobtrusive window suitable for leaving open alongside other work
Why You Might Need This Tool
This is the tool to leave running quietly while you work on something memory-hungry — a large photo or video edit, a virtual machine, a heavy IDE with several projects open — so you can watch usage climb in real time rather than switching to Task Manager every few minutes to check. It is equally useful when diagnosing a memory leak: watching the used-memory percentage creep upward over hours without ever coming back down, even when the offending application appears idle, is one of the clearest signs something is not releasing memory it should be releasing.
It also earns a place as a quick sanity check before starting a memory-intensive task — glancing at free memory before opening a large virtual machine, importing a huge dataset, or spinning up several browser tabs full of heavy web apps can save you from starting a job that is doomed to swap heavily or fail partway through. Because the window is small and unobtrusive, it tiles well alongside a game, a stream-recording application, or a build process where you want an at-a-glance early warning if memory is running critically low, without dedicating a full monitor or a Task Manager window to the job.
How It Works
The tool queries Win32_OperatingSystem via WMI for two properties:
TotalVisibleMemorySize and FreePhysicalMemory, both
reported in kilobytes. Used memory is calculated as the difference between the two,
and the used-memory percentage is simply used divided by total, multiplied by 100
and rounded to one decimal place. All four figures — total, used, free and
percentage — are converted from kilobytes to megabytes for readability and refreshed
automatically on a timer when auto-refresh is enabled, giving a continuously updating
live dashboard rather than a single static snapshot.
How to Use It
Launch the tool and the current memory breakdown appears immediately. Leave the window open in a corner of your screen with auto-refresh enabled to monitor memory pressure passively while you work, or use the manual Refresh button to grab a single reading. Use Copy when you need to paste the exact numbers into a bug report or a conversation with technical support.
System Requirements & Notes
Runs on 64-bit Windows 10 and Windows 11 and requires no administrator privileges — reading system-wide memory totals through WMI is available to any standard user account.
Frequently Asked Questions
Why does "Used" memory here differ slightly from Task Manager's number?
Task Manager includes additional memory-accounting concepts (like standby cache
pages Windows can reclaim instantly) in some of its figures. This tool reports the
simpler total-minus-free calculation, which is easier to reason about but will not
always match Task Manager's "In Use" figure exactly.
Does this tool break down usage by process?
No — for a per-process view, Task Manager or CurrProcess
on this site are better suited. This tool is intentionally a single system-wide
summary.
Can I change the refresh interval?
The tool ships with a sensible default refresh rate and an on/off toggle rather than
a configurable interval, keeping the interface as simple as the data it shows.
Does leaving this running use noticeable RAM itself?
No — the tool's own footprint is a few megabytes at most, small enough that it will
not meaningfully skew the very numbers it is reporting, even when left open for hours
alongside heavier applications.