Overview
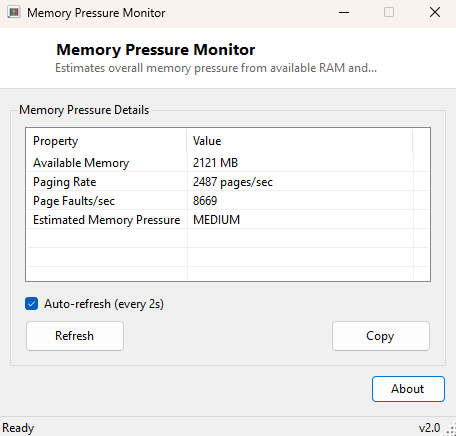
Memory Pressure Monitor combines two separate signals — how much physical memory is currently available, and how actively the system is paging data to and from disk — into a single, easy-to-read Low, Medium or High pressure estimate. Neither number alone tells the whole story: available memory can look fine for a moment while paging activity is already climbing, and paging rate alone does not tell you how close the system actually is to running critically low. This tool watches both at once and gives a plain-language verdict rather than making you interpret two raw numbers yourself every time you want a quick read on system health.
Modern operating systems, Windows included, do not expose a single official "memory pressure" metric the way some other platforms do, which is exactly the gap this tool tries to close with a practical, transparent estimate rather than leaving you to mentally combine an available-memory figure and a paging-rate figure every single time you want a quick read on how a system is actually coping.
Key Features
- Reports available physical memory in megabytes
- Reports live paging rate (pages per second)
- Reports page faults per second for additional context
- Combines both into a plain Low/Medium/High pressure estimate
- Auto-refreshes every two seconds
Why You Might Need This Tool
This tool is built for the moment a system "feels slow" in a way that is hard to pin down from Task Manager's headline percentage alone — memory pressure is often the real underlying cause of sluggishness that shows up as generally poor responsiveness rather than one obvious culprit process. Running it alongside a memory-heavy task lets you watch pressure climb from Low to Medium to High in real time and correlate that directly with when the system actually starts to feel sluggish, which is far more useful than staring at a single available-memory number with no sense of what threshold actually matters for your specific machine.
How It Works
Each refresh queries Win32_PerfFormattedData_PerfOS_Memory via WMI for
AvailableMBytes, PagesPersec and
PageFaultsPersec — the same counter category Windows' own Performance
Monitor exposes under the Memory object. The tool then applies a simple heuristic:
available memory below roughly 512MB is treated as High pressure regardless of
paging activity, available memory below about 2GB combined with an elevated paging
rate is treated as Medium, and anything comfortably above both thresholds with a
quiet paging rate is treated as Low. This is intentionally a practical estimate
rather than an official Windows-defined metric — no single figure like this exists
natively in Windows — designed to match how memory pressure actually tends to feel
to a user in practice.
How to Use It
Leave the tool running in the background during normal use, or deliberately open several memory-heavy applications at once to watch the pressure estimate respond. A jump to High that coincides with the system actually feeling sluggish confirms memory is the bottleneck; if pressure stays Low despite a system feeling slow, the bottleneck is more likely CPU or disk, worth checking with CPU Load Monitor or Drive Activity Monitor instead. Because the verdict updates every two seconds, it is also a reasonable ambient indicator to keep visible on a secondary monitor while multitasking across several demanding applications at once.
System Requirements & Notes
Runs on 64-bit Windows 10 and 11 without requiring administrator rights, since all of the underlying performance counters are readable by a standard user account.
Frequently Asked Questions
Are the Low/Medium/High thresholds official Windows values?
No — they are a practical heuristic built into this tool specifically, combining
available memory and paging rate in a way chosen to match real-world experience
rather than any single documented Windows threshold.
Can pressure be High even with lots of total RAM installed?
Yes — total installed RAM does not matter to this estimate, only how much is
currently available and how actively the system is paging right now, both of which
can spike temporarily even on a well-equipped machine under heavy enough load.
Should I trust this over Windows' own Resource Monitor?
Think of it as a faster, plainer-language companion rather than a replacement —
Resource Monitor exposes the same underlying counters in far more detail for deep
diagnosis, while this tool trades that detail for a single glanceable verdict you can
read in under a second.