Overview
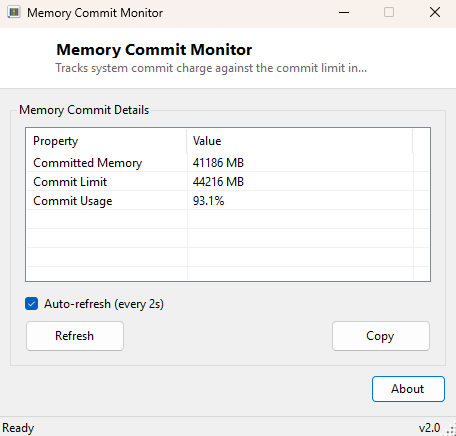
Memory Commit Monitor tracks a number that matters far more to system stability than the simple "RAM used" percentage most people watch: the commit charge, and how close it is running to the system's commit limit. Commit charge represents the total amount of virtual memory the operating system has promised to back with either physical RAM or page file space across every running process, and the commit limit is the maximum it can currently promise given installed RAM plus configured page file size. When commit charge approaches the commit limit, Windows is at real risk of memory-allocation failures — not just slowness, but applications outright failing to allocate memory — which is a very different and more serious situation than simply running low on free physical RAM.
This distinction trips up a lot of people troubleshooting memory issues, because Task Manager's main percentage figure and the commit charge figure genuinely measure different things and can diverge noticeably from each other. A system with plenty of free physical RAM can still have a commit charge climbing dangerously close to its limit if enough processes have reserved large amounts of virtual address space without necessarily touching all of it yet — a pattern common with certain databases, virtualization software and some poorly-behaved applications that over-allocate defensively.
Key Features
- Shows current commit charge alongside the system's commit limit, both in MB
- Calculates and displays commit usage as a live percentage
- Auto-refreshes every two seconds
- Uses the same performance counter category Resource Monitor's Commit Charge graph reads from
- No configuration required
Why You Might Need This Tool
This tool earns its keep specifically in the scenario where a system feels like it is "running out of memory" even though Task Manager's headline RAM percentage does not look alarming — because commit charge accounts for virtual memory reservations across all processes, including memory that is reserved but not yet actively touched, it can climb toward the limit well before physical RAM usage looks dangerous on its own. Developers running memory-heavy build tools, virtualization users running several VMs simultaneously, and anyone who has hit a mysterious "not enough memory" error from an application that otherwise looked fine in Task Manager are the people who benefit most from watching this specific number rather than the more commonly cited RAM-used percentage.
How It Works
The tool queries Win32_PerfFormattedData_PerfOS_Memory via WMI for the
CommittedBytes and CommitLimit performance counters — the
exact same counter category that underlies the Commit Charge graph in Windows'
built-in Resource Monitor (resmon.exe), so the numbers reported here
will match what that tool shows. Both values arrive in bytes and are converted to
megabytes for display, and usage percentage is simply committed bytes divided by
the commit limit. The commit limit itself is not a fixed number — it grows and
shrinks as Windows dynamically resizes the page file, so a rising commit-limit value
alongside rising commit charge can indicate the system is actively expanding the
page file to keep up with demand.
How to Use It
Open the tool and watch commit charge and the commit limit update every two seconds. A commit usage percentage that climbs steadily toward 90% or higher, especially if it stays there rather than settling back down, is a strong early warning sign worth acting on — either closing memory-heavy applications, adding more physical RAM, or manually increasing page file size via Large Page File Creator.
System Requirements & Notes
Runs on 64-bit Windows 10 and 11 without requiring administrator rights, since reading performance counter data through WMI is a standard-user operation.
Frequently Asked Questions
Is commit charge the same thing as RAM usage?
No — commit charge counts total virtual memory reserved across all processes,
which can be backed by physical RAM or by the page file, and can exceed physical RAM
size entirely as long as the page file has room.
What should I do if commit usage stays near 100%?
Close unnecessary applications first; if the problem persists, consider adding more
physical RAM or increasing your page file size, since a commit limit that is
consistently maxed out risks outright allocation failures rather than just slowness.
Why does the commit limit itself change over time?
Windows dynamically resizes a system-managed page file as demand changes, and the
commit limit is essentially installed RAM plus current page file size, so watching
the limit rise alongside charge is a sign Windows is actively working to keep pace
with your system's memory demands rather than an error.