Overview
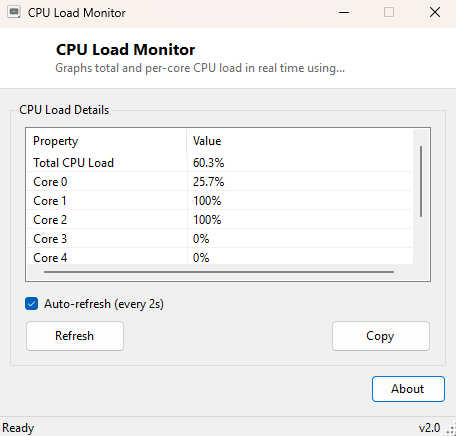
CPU Load Monitor is a live, auto-refreshing view of processor utilization — total system load first, followed by a per-core breakdown so you can see exactly which logical processors are actually doing work at any given moment. It reads from the exact same performance counter infrastructure that Task Manager and Resource Monitor are built on, so the numbers you see here will always agree with what those tools report, just in a smaller, faster-loading window you can leave open in a corner of the screen.
Key Features
- Total CPU load plus a separate reading for every individual logical core
- Auto-refreshing display with a toggleable live-update interval
- Reads directly from Windows performance counters — the same source Task Manager uses
- Lightweight enough to run continuously alongside a game or a benchmark without measurably affecting results
- Copy-to-clipboard for a full snapshot of every core's load at once
Why You Might Need This Tool
The most common use is diagnosing whether a slowdown is genuinely CPU-bound before spending time chasing the wrong bottleneck — if total load sits comfortably under 100% while a game or application stutters, the problem is more likely GPU, disk, or memory related, and this tool rules CPU load out in seconds. The per-core breakdown is particularly useful for spotting single-thread bottlenecks in older or poorly multi-threaded software: if one core sits pinned at 100% while every other core idles, that is a classic sign the running application simply cannot use additional cores, no matter how many you have installed. It is also a handy live companion while running one of this catalog's own stress tests — Core2MaxPerf or IntelBurnTest — to confirm every core is genuinely being pushed to 100% and none are being silently throttled or parked.
How It Works
The tool creates a System.Diagnostics.PerformanceCounter against the
"Processor" category's "% Processor Time" counter, first for the special "_Total"
instance to get overall system load, then for each numbered instance from 0 up to
Environment.ProcessorCount - 1 to get per-core figures. Performance
counters of this type require two consecutive samples with a short delay between them
to produce a meaningful percentage — the first call to NextValue()
establishes a baseline and is discarded, and the tool waits briefly (200 milliseconds
for the total counter, 10 milliseconds per core) before taking the real reading, which
is standard practice for this counter type and matches how Task Manager itself samples
the same data. Per-core counter objects are created and disposed fresh on every refresh
cycle to avoid holding stale handles open indefinitely.
How to Use It
Launch the tool and it immediately shows total CPU load followed by each core's individual reading, refreshing automatically at the configured interval if auto-refresh is enabled. Leave it running in a corner of the screen while gaming, rendering, or compiling to watch load distribution in real time, or use the manual Refresh button for a single on-demand snapshot.
System Requirements & Notes
Runs on 64-bit Windows 10 and Windows 11, no administrator rights required — reading standard performance counters is available to any user account by default. On systems with a very high core count, the per-core breakdown will naturally produce a longer list, which is expected behavior rather than a bug.
Frequently Asked Questions
Why does total load sometimes not exactly equal the average of all cores?
Small discrepancies are normal due to the brief timing gap between when the total
counter and each individual core counter are sampled — load can shift slightly
between those moments, especially on a busy system.
Does running this tool itself affect CPU load?
Its own footprint is negligible — reading a handful of performance counters is a
lightweight operation designed for exactly this kind of continuous background
monitoring.