Overview
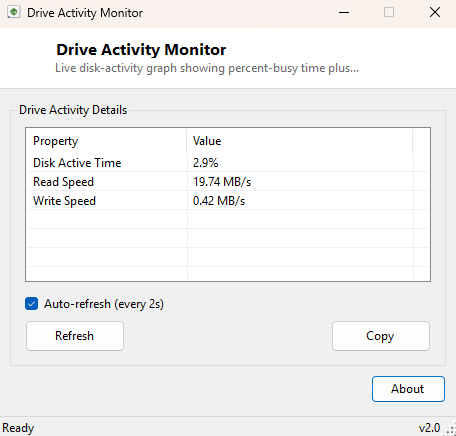
Drive Activity Monitor answers a question Task Manager's Performance tab only half-answers: exactly how busy is the disk right now, in terms both of percent-busy time and actual read/write throughput. Task Manager gives you a single combined graph per disk and buries the raw numbers a click or two deep; this tool puts percent-busy time, read speed and write speed in one compact auto-refreshing window with nothing else competing for your attention.
It is a live monitor, not a one-time snapshot tool — the whole point is watching the numbers move in response to whatever you are doing, whether that is confirming a large copy operation is actually progressing, checking whether a mysteriously slow PC has a disk pinned at 100% busy in the background, or simply satisfying curiosity about how much data an application is really moving.
Key Features
- Live percent-busy ("Disk Active Time") reading updated every second
- Separate live read-speed and write-speed figures in MB/s
- Auto-refresh checkbox to pause updates without closing the window
- Manual Refresh button for an on-demand single reading
- Compact single-window layout with no configuration required
- Reads the same underlying counters Windows' own Resource Monitor uses
Why You Might Need This Tool
The most direct use is diagnosing a system that feels sluggish for no obvious reason — a spinning HDD or a heavily-loaded SSD pinned near 100% active time explains a lot of "everything feels slow" complaints that CPU and RAM monitors will not catch, since the bottleneck is disk I/O rather than processing power. It is equally useful in the opposite direction: confirming a large file copy, backup job or virtual machine disk operation is actually making progress by watching the write-speed figure move, rather than staring at a stalled-looking progress bar and wondering if the operation has silently frozen. Anyone benchmarking real-world (as opposed to synthetic) storage performance for their own workload — copying a real project folder rather than running a dedicated benchmark tool — will find this a useful companion for watching sustained throughput rather than a burst number.
How It Works
The tool reads three Windows performance counters from the
PhysicalDisk category using the
System.Diagnostics.PerformanceCounter class: "% Disk Time" for the
_Total instance gives the percent-busy figure, while "Disk Read
Bytes/sec" and "Disk Write Bytes/sec" give the raw throughput numbers, which the
tool then divides down from bytes to megabytes for readability. These are the
exact same low-level counters that power Task Manager's own disk graph and
Resource Monitor's Disk tab — the tool is simply reading the same data Windows
already tracks internally and presenting it more directly. Because a
freshly-created performance counter's first read is unreliable (it needs a brief
interval to establish a baseline), the tool takes an initial throwaway reading and
waits briefly before displaying real numbers, then refreshes all three values on a
one-second timer as long as auto-refresh stays enabled.
How to Use It
Launch the tool and the three readings begin updating automatically — there is nothing to configure. Watch "Disk Active Time" for overall busy percentage, and the Read/Write Speed fields for actual throughput while a copy, backup or other disk-heavy operation runs. Untick "Auto-refresh" if you want to freeze the display at a specific moment to read the numbers without them changing under you, and use the Refresh button to grab one fresh reading while paused.
System Requirements & Notes
Runs on 64-bit Windows 10 and Windows 11 without requiring administrator rights —
performance counters are readable by any standard user account. The percent-busy
and throughput figures are aggregated across all physical disks combined (the
_Total instance) rather than broken out per individual drive, so on a
multi-drive system this reflects overall storage subsystem activity rather than a
specific disk.
Frequently Asked Questions
Why does percent-busy sometimes read differently from throughput being low?
A drive can be 100% "busy" while moving relatively little data if it is servicing
many small, scattered I/O requests (common with a fragmented HDD or a database
workload) rather than one large sequential transfer — busy time measures how much
of the time the disk has an outstanding request, not how much data is moving.
Can I monitor a specific drive letter instead of the combined total?
Not in this version — it reports the combined total across all physical disks. For
per-drive free-space tracking specifically, see Drive Free Space Monitor instead.
Does this tool write anything to disk itself?
No — it only reads performance counter data and never writes files, so it does not
skew the very activity it is measuring.