Overview
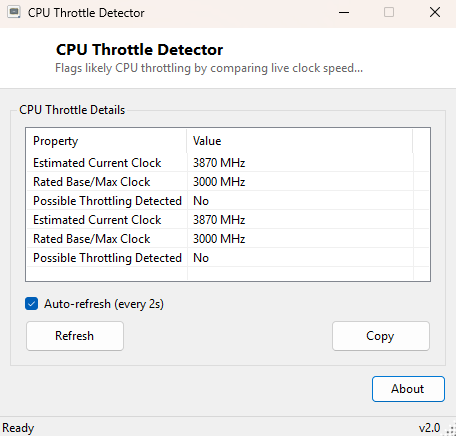
CPU Throttle Detector watches for the specific, frustrating symptom of a processor quietly running well below its rated speed for reasons that are not obvious from the Task Manager percentage-load graph alone. Thermal throttling, power-limit throttling and background power-plan restrictions can all make a CPU feel underpowered even though load looks perfectly normal at a glance, and Windows does not surface a simple "yes, this is throttled right now" indicator anywhere in its own built-in UI. This tool estimates the live effective clock speed and compares it directly against the processor's rated base clock, flagging a likely throttle condition when the gap between the two gets too large to be normal idle power-saving behavior.
It fills a genuine gap: enthusiast monitoring suites can show this, but installing an entire hardware-monitoring application just to answer one yes-or-no question is overkill for most people, most of the time.
Key Features
- Reports the processor's rated base/max clock speed from firmware
- Estimates the live effective clock speed using Windows performance counters
- Flags a clear YES/NO likely-throttling verdict based on the gap between the two
- Auto-refreshes every two seconds so you can watch behavior change under load
- No third-party sensor driver required
Why You Might Need This Tool
The most common real-world trigger is a laptop that feels noticeably slower after running for ten or fifteen minutes under sustained load — a classic sign of thermal throttling as heat builds up faster than the cooling system can dissipate it. It is equally useful after a BIOS update or a manual power-limit change, where a new conservative default can silently cap sustained performance well below what the chip is actually rated for, without any error message telling you so. Running this tool side-by-side with a CPU stress test like Intel Burn Test or Core2MaxPerf gives you a fast before- and-after way to confirm whether a cooling upgrade, a repaste, or cleaning built-up dust out of a laptop's heatsink actually fixed a throttling problem rather than just feeling like it did.
How It Works
The tool first reads MaxClockSpeed from Win32_Processor via
WMI to establish the rated base clock in MHz. It then queries
Win32_PerfFormattedData_Counters_ProcessorInformation, filtering for the
_Total instance's PercentProcessorPerformance counter — the
same underlying performance-counter data Windows' own Task Manager and Resource
Monitor use to estimate effective frequency, since modern CPUs with per-core boost
and idle states do not report a single, stable "current clock speed" the way older
fixed-frequency chips did. Multiplying the rated base clock by that live percentage
produces an estimated effective frequency. If that estimate falls more than roughly
ten percent below the rated base clock while the counter itself indicates the CPU is
under real load, the tool reports a likely-throttling condition; otherwise it reports
normal operation, since brief dips at idle are completely expected and not a fault.
How to Use It
Open the tool and leave it running while you use the machine normally, or deliberately load the CPU with a benchmark tool to see how the estimate responds under sustained load rather than a short burst. A verdict that flips to YES only under heavy sustained load and returns to NO within a few seconds of idle is normal and expected behavior; a verdict that stays YES even at light, everyday load is worth investigating further, typically starting with cooling and dust buildup before assuming a hardware fault.
System Requirements & Notes
Runs on 64-bit Windows 10 and 11, no administrator rights required. Because this tool relies on a percentage-based performance counter rather than a direct hardware register read, its estimate is a strong indicator rather than a certified measurement — for definitive diagnosis alongside real temperature data, pair it with CPU Temperature Monitor and watch both readouts together during a stress test.
Frequently Asked Questions
Does a YES verdict always mean thermal throttling specifically?
Not necessarily — it means effective clock speed is running well below rated base
clock, which can also be caused by a restrictive power plan, a firmware power-limit
setting, or, rarely, background load on other threads skewing the aggregate counter
momentarily.
Why does the estimate jump around even at idle?
Modern CPUs constantly adjust frequency for power efficiency at idle and light load,
so brief dips well below rated speed are completely normal and not evidence of a
cooling problem.
Can this tool tell me exactly how many degrees I need to cool the CPU by?
No — it only reports whether throttling is likely occurring right now, not a
prescriptive temperature target; pair it with a temperature monitor for that kind of
detail.