Overview
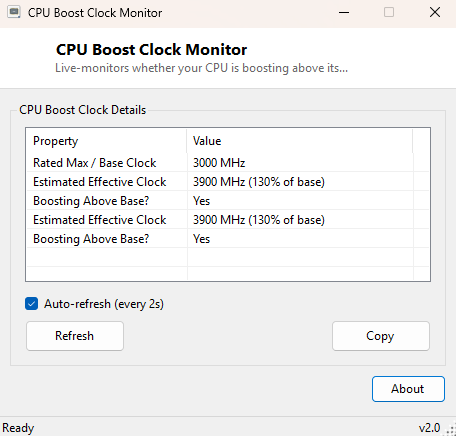
CPU Boost Clock Monitor answers a very specific question in real time: right now, at this instant, is your processor running above its rated base clock speed, and by how much? Modern CPUs from both Intel and AMD spend most of their time dynamically adjusting frequency based on thermal headroom, power limits and workload — the single "clock speed" number on a spec sheet is really just a baseline the chip is frequently running well above or, under thermal pressure, sometimes below. This tool watches that live behavior continuously rather than reporting a single static number.
It is designed to answer the practical question people actually have during a benchmark run, a game session, or a cooling upgrade: is the boost behaving the way it should, or is something (heat, power limits, background load) holding the chip back from reaching the speeds it is rated for.
Key Features
- Reports the CPU's rated maximum/base clock speed as a reference baseline
- Live-estimates the processor's current effective clock speed
- Shows the current speed as a percentage of the rated base clock
- Explicitly flags whether the CPU is currently boosting above its base rating
- Optional auto-refresh with a configurable interval, matching the site-wide live monitor pattern
- Copy button to grab the current reading for a bug report or forum post
Why You Might Need This Tool
Boost behavior is one of the hardest things to verify without dedicated tooling — Task Manager shows load percentage, not effective clock speed, and most built-in Windows tools do not expose this at all. If you have just installed a new cooler and want to confirm the CPU is actually boosting higher than before, or you suspect a laptop is thermal-throttling under sustained load and staying pinned near its base clock instead of boosting, or you simply want to watch how aggressively a chip ramps frequency during a specific task, this tool gives you a live, continuously updating answer rather than a one-time snapshot buried in a benchmark's summary screen.
How It Works
The tool first queries Win32_Processor via WMI for
MaxClockSpeed, which gives the rated base/maximum clock in MHz as
reported by firmware. It then queries the
Win32_PerfFormattedData_Counters_ProcessorInformation WMI performance
counter class for the _Total instance's
PercentProcessorPerformance value — a Windows-provided metric that,
unlike raw CPU load, reflects actual delivered performance relative to the
nominal/base frequency, including the effect of frequency scaling and boost states.
Multiplying the rated base clock by this percentage gives an estimated effective
clock speed in MHz. When that percentage exceeds 100%, the tool reports the CPU as
currently boosting above its base rating; at or below 100%, it is running at or
below the nominal baseline. With auto-refresh enabled, this calculation repeats on
the configured interval so the reading tracks live changes in workload.
How to Use It
Launch the tool and it immediately shows the rated base clock alongside the current estimated effective clock and boost percentage. Enable auto-refresh to watch the numbers update continuously — useful to leave open in a corner of the screen while running a game, benchmark or render job elsewhere. Click Refresh at any time for an immediate manual update, or Copy to save the current reading to the clipboard.
System Requirements & Notes
Runs on 64-bit Windows 10/11 and does not require administrator rights — both the
WMI class and the performance-counter data it reads are available to standard
users. Accuracy depends on how faithfully the CPU driver reports
PercentProcessorPerformance, which is generally reliable on modern
Intel and AMD systems but may behave differently on older or virtualized hardware.
Frequently Asked Questions
Why does the estimated clock speed jump around so much?
That is expected — modern CPUs adjust frequency many times per second based on
workload, and the tool is sampling a live, constantly-changing value rather than a
fixed number.
Is this the same as a "core clock" reading in a game overlay?
It is conceptually similar but derived from Windows' own performance counters rather
than a vendor-specific monitoring driver, so it will not always match exactly, though
it tracks the same underlying boost behavior.
My CPU never shows above 100% — is boost broken?
Check your Windows power plan first; some balanced/power-saver plans cap maximum
processor state below 100%, which limits boost headroom regardless of thermal
capacity.