Overview
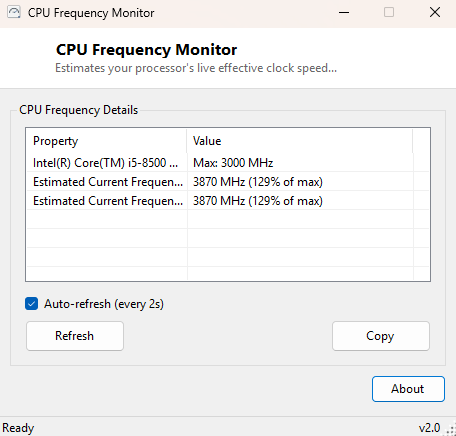
Task Manager's Performance tab shows you a single CPU speed number and leaves you to wonder how accurate it really is. Modern processors change their clock speed dozens of times a second depending on load, thermal headroom and power plan, so any single snapshot is really just a guess at what the chip happened to be doing the instant the reading was taken. CPU Frequency Monitor exists to give that guess a little more rigor — it reads your processor's rated maximum clock speed once, then continuously estimates the current effective clock speed from live Windows performance counters, refreshing automatically so you can watch the number move in real time as load changes.
This is not a benchmark and it does not claim laboratory precision — it is a convenient, always-on window into whether your CPU is running near its rated speed, well below it (which can indicate throttling), or boosting above it under a light, bursty workload.
Key Features
- Shows the CPU's rated maximum clock speed straight from firmware
- Estimates the live effective clock speed as a percentage of that maximum
- Auto-refresh checkbox with a live-updating timer, so the reading moves without you clicking anything
- One-click Copy button to grab the current readings as text
- Graceful fallback message if performance counters are unavailable on a locked-down system
- No installation, no background service — only runs while the window is open
Why You Might Need This Tool
The most common reason to reach for this tool is suspicion that a CPU is not running as fast as it should be — a laptop that feels sluggish under load, a desktop that seems to bog down after running for a while, or simply curiosity about whether a power plan set to "Balanced" is quietly capping performance below what "High Performance" would allow. Watching the estimated frequency climb and fall as you open applications, compile code, or run a benchmark alongside this tool gives you a live feel for how responsive the CPU's frequency scaling actually is, rather than trusting a single static number.
How It Works
On load, the tool queries Win32_Processor via WMI for
MaxClockSpeed, the rated top speed reported by firmware. It then
queries the Win32_PerfFormattedData_Counters_ProcessorInformation WMI
performance counter class, specifically the _Total instance's
PercentProcessorPerformance value — this is the same underlying counter
Windows itself uses internally to represent how hard the CPU is working relative to
its base speed, and it can legitimately exceed 100% during a boost state. Multiplying
the rated maximum clock by that percentage gives an estimated effective frequency in
MHz, which is displayed alongside the raw percentage. If the auto-refresh checkbox is
ticked, a timer repeats this query automatically; if the performance counter query
fails (which can happen on heavily locked-down systems where WMI performance counters
are disabled), the tool reports that plainly rather than showing a fabricated number.
How to Use It
Launch the tool and the current reading appears immediately — no configuration is needed. Leave "Auto-refresh" checked to watch the estimated frequency update on its own, or uncheck it and use the Refresh button to take manual snapshots at moments you choose, such as right before and after launching a demanding application. Use Copy to paste the current readings into a support ticket or a forum post if you are troubleshooting a performance complaint with someone else's help.
System Requirements & Notes
Runs on 64-bit Windows 10 and Windows 11 and does not require administrator rights — both the WMI class and the performance counter it reads are available to standard user accounts. On virtual machines and some heavily customized enterprise images, the performance counter subsystem may be disabled by policy, in which case the tool falls back to showing only the rated maximum clock speed.
Frequently Asked Questions
Is the "estimated" frequency exact?
No — it is calculated from a performance ratio rather than read directly from the
CPU's internal clock registers, so treat it as a close, useful approximation rather
than a lab-grade measurement.
Why does the percentage sometimes read above 100%?
That reflects genuine turbo/boost behavior — many modern CPUs are designed to run
temporarily above their advertised base clock when thermal and power headroom allow.
Does this tool show per-core frequency?
No, it reports a single system-wide estimate. For a per-core breakdown of load
instead of frequency, see CPU Load Monitor.
Why do I sometimes see "Perf counters unavailable" instead of a reading?
A small number of heavily locked-down or minimal-footprint Windows installations
disable the performance-counter subsystem entirely, which prevents any tool
(including this one and Task Manager's own graphs) from querying live processor
performance data. When that happens, the tool still shows the rated maximum clock
speed from firmware, just without the live estimate layered on top.