Overview
wPrime is a classic-style multi-threaded CPU benchmark, named after and modeled on the original community tool that became a fixture of overclocking forums in the mid-2000s. Unlike single-threaded calculators of the same era, wPrime was built from the start around the idea that a benchmark should scale across every core a processor has, since by the time it appeared dual and quad-core desktop CPUs were already becoming common and single-threaded numbers were starting to say less and less about real-world performance. This reimplementation keeps that same spirit — pick a workload size, pick a thread count, and see how quickly your CPU chews through it.
Rather than actually computing digits of Pi the way its namesake historically did, this version uses a computationally equivalent square-root-heavy workload spread evenly across however many threads you choose, which keeps every core saturated with floating-point work for the entire run and produces a timing result that scales predictably with both clock speed and core count.
Key Features
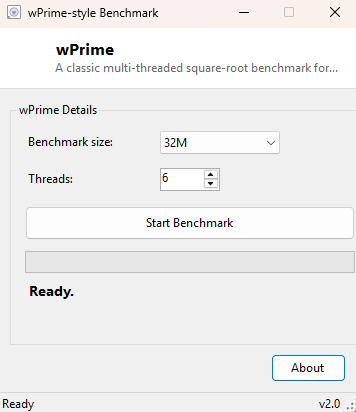
- Two workload sizes to choose from — 32M for a quick run, 1024M for a longer, more stable result
- Configurable thread count, defaulting to your CPU's full logical processor count
- Runs entirely on background threads so the UI stays responsive during a test
- Reports total elapsed time in seconds to three decimal places for precise comparison
- Marquee progress indicator so you always know a run is still in progress
Why You Might Need This Tool
wPrime-style benchmarks are most useful as a quick, repeatable sanity check — after applying a new overclock, after changing RAM timings, or after a BIOS update, running the same workload size and thread count and comparing the elapsed time against a previous run tells you immediately whether the change actually helped, hurt, or made no measurable difference. It is also a convenient way to compare two different machines side by side using a number that is much easier to communicate than "it feels faster" — two systems running the 1024M workload with the same thread count produce directly comparable elapsed times.
How It Works
When you click Start, the tool divides your chosen workload count evenly across the
number of threads you selected and launches that many long-running tasks via
Task.Factory.StartNew with TaskCreationOptions.LongRunning,
which asks the .NET thread pool to give each one a dedicated OS thread rather than
sharing pooled worker threads — important for a CPU-bound benchmark, since pooled
threads can introduce scheduling overhead that would distort the timing. Each thread
runs a tight loop repeatedly applying Math.Sqrt to an accumulating
value, a workload chosen specifically because square root is a genuinely expensive
floating-point operation that cannot be optimized away by the compiler. A
Stopwatch starts the instant all threads are launched and stops the
moment Task.WaitAll confirms every thread has finished its share of the
work, giving a single elapsed-time figure for the entire run.
How to Use It
Choose a workload size from the dropdown — 32M for a run that finishes in seconds, 1024M for a longer, more thermally representative test — set the thread count (it defaults to your logical processor count, which is usually the setting you want), and click Start Benchmark. The result label updates with the total elapsed time once every thread finishes. For the most comparable results between runs, close other CPU-intensive background applications first and let the system idle for a few seconds before starting.
System Requirements & Notes
Requires no administrator privileges and no internet connection. Because it drives every selected core to 100% utilization for the duration of the run, expect fan noise and a temperature rise on laptops and small-form-factor systems — this is expected and not a sign of a problem with the tool itself.
Frequently Asked Questions
Can I compare my result with the original wPrime's published scores?
No — this is a modern reimplementation using a different underlying workload and
runtime, so its timings are only meaningful when compared against other runs of
this same tool, not against historical wPrime 1024M/32M leaderboard numbers.
Why did my second run come back slower than my first?
Thermal throttling is the most common cause — back-to-back full-load runs can push
a CPU warm enough that its boost clock backs off. Let the system cool for a minute
between runs for consistent comparisons, or check CPU Throttle Detector
while it happens.
Should I use fewer threads than my CPU has?
Only if you specifically want to measure single-core or partial-load performance;
for the most representative overall benchmark, leave the thread count at its
default full logical processor count.