To visualize model performance and feature importance, I typically use Seaborn’s bar plots for feature importance and confusion matrices via Matplotlib’s imshow function. These visualizations provide clear insights into which…
Tag
#matplotlib
How do you effectively use Matplotlib and Seaborn to visualize the results of a machine learning model, specifically in terms of understanding feature importance and model performance?
🏷️
How would you ensure that sensitive data is securely handled and visualized when using Matplotlib or Seaborn in a web application?
To secure sensitive data in Matplotlib or Seaborn, I would ensure that data is anonymized or aggregated before visualization. Additionally, I would implement access controls to restrict who can view…
🏷️
How would you optimize the performance of a Matplotlib or Seaborn visualization that is rendering a very large dataset with millions of points?
To optimize performance, I would utilize techniques like downsampling the data, using more efficient plot types, and leveraging Matplotlib’s built-in optimization flags. Additionally, using data aggregations or binning could significantly…
🏷️
How would you effectively use Matplotlib and Seaborn together to create a comprehensive data visualization pipeline for exploratory data analysis?
I would use Seaborn for quick, high-level visualizations due to its appealing aesthetics and statistical capabilities, such as pair plots and heatmaps. Once I identify patterns and outliers, I’d switch…
🏷️
How can you efficiently visualize large datasets using Matplotlib or Seaborn while ensuring the performance remains optimal?
To visualize large datasets efficiently in Matplotlib or Seaborn, you should consider data sampling, or aggregation techniques to reduce the number of points plotted. Additionally, using appropriate plot types, such…
🏷️
Can you explain how to effectively use Matplotlib and Seaborn to visualize a dataset that contains missing values?
To visualize datasets with missing values in Matplotlib and Seaborn, I first clean the data by either filling in or dropping the missing values. Seaborn’s ‘dropna()’ method is helpful to…
🏷️
How would you approach optimizing a large dataset visualization in Matplotlib or Seaborn to ensure performance while maintaining clarity in the displayed information?
To optimize visualizations for large datasets in Matplotlib or Seaborn, I would consider downsampling the data, using efficient plotting techniques like hexbin or scatter plots with transparency, and caching results…
🏷️
How would you use Matplotlib or Seaborn to visualize the distribution of a dataset, and what plot types would be most effective for this purpose?
To visualize the distribution of a dataset, I would typically use histograms or box plots in Matplotlib or Seaborn. Histograms provide a good view of the frequency of data points…
🏷️
Can you describe a time when you had to communicate complex data insights through visualizations? How did you ensure the audience understood?
In a recent project, I had to present user engagement metrics to stakeholders. I focused on using clear, simple visualizations with Matplotlib, highlighting key trends and insights while avoiding clutter.…
🏷️
Can you explain how to create a simple line plot using Matplotlib, and what parameters you might commonly use?
To create a simple line plot in Matplotlib, you can use the ‘plot’ function, supplying it with x and y data points. Common parameters include ‘color’ for the line’s color,…
🏷️
Can you explain how to create a simple line chart using Matplotlib and what parameters you need to set?
To create a simple line chart using Matplotlib, you can use the plot function with x and y data. You will need to import Matplotlib, and you can customize the…
🏷️
How do you ensure that the data visualizations you create with Matplotlib or Seaborn do not expose sensitive information, especially when sharing visuals publicly?
To ensure data visualizations do not expose sensitive information, I apply filtering techniques to remove or anonymize any identifiable data before plotting. Additionally, I limit the amount of data displayed…
🏷️
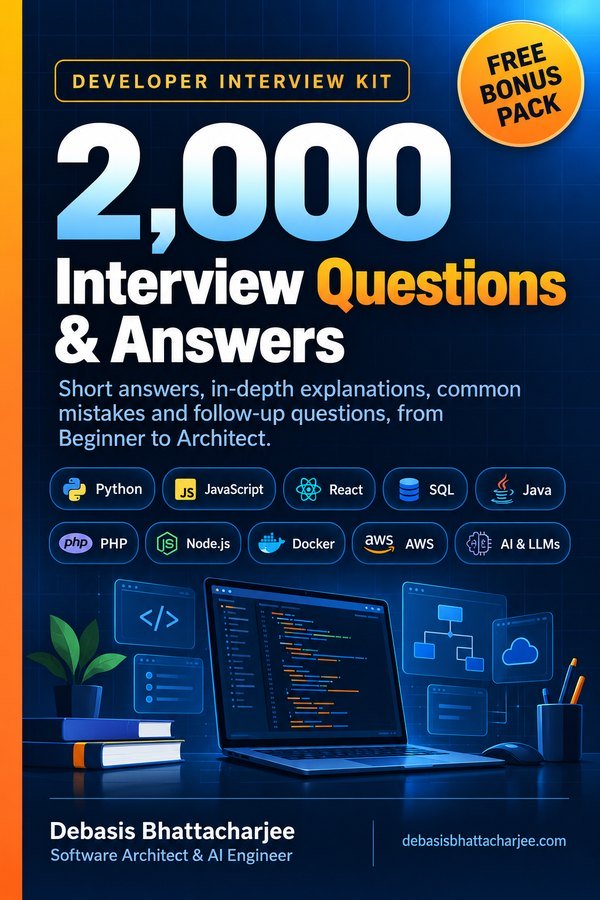
Developer Interview Kit · PDF

2,000 Interview Questions & Answers, in one PDF
- Short answers, in-depth explanations, common mistakes and follow-ups
- 89 topics, from Beginner to Architect, with a clickable contents list
- 226 extra questions that are not on this website
- Free Bonus Pack: 30-day study plan, behavioral questions, salary scripts
$7.99 one-time · instant email delivery
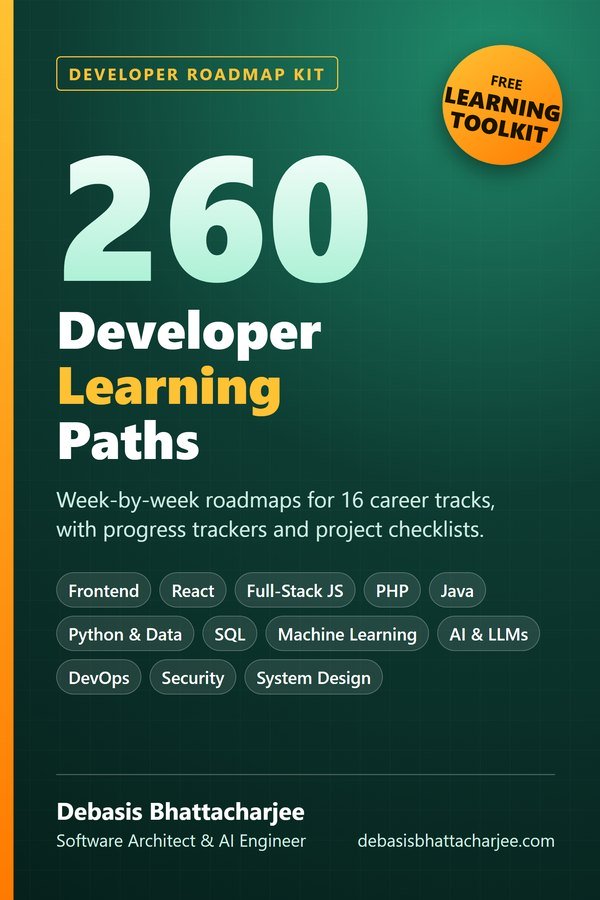
Also available: 260 Developer Learning Paths $4.99
Week-by-week roadmaps for 16 career tracks (Python, React, Java, DevOps, SQL, AI and more), with a progress tracker on every path.
See what's inside →
Get both books for $9.99 (save $2.99):
The material stays free to read online. This is the organised, offline, print-ready PDF edition. Secure payment by PayPal; your personal download link is emailed after payment is confirmed. Digital product, no shipping.