To optimize performance with large datasets in Matplotlib or Seaborn, I would use techniques like downsampling the data, using simpler plot types, and leveraging the `blit` parameter for animations. Additionally,…
Tag
#matplotlib
What techniques can you use to optimize the performance of visualizations created with Matplotlib or Seaborn when handling large datasets?
🏷️
Can you describe a time when you had to visualize complex data using Matplotlib or Seaborn, and how you ensured the visualizations were clear and informative?
In a school project, I visualized a dataset containing student grades and demographics using Seaborn. I created multiple plots to represent different aspects, like box plots for grade distributions and…
🏷️
Can you explain how to create a simple line plot using Matplotlib, and what basic parameters you might use?
To create a simple line plot in Matplotlib, you can use the plt.plot() function. Basic parameters include x and y coordinates to specify the data points, as well as optional…
🏷️
How do you ensure that the data visualizations you create with Matplotlib or Seaborn are secure against potential vulnerabilities, such as data leakage or exposure of sensitive information?
To ensure security in data visualizations, I always sanitize the data before visualization, avoiding the display of any personally identifiable information. Additionally, I use role-based access controls to restrict who…
🏷️
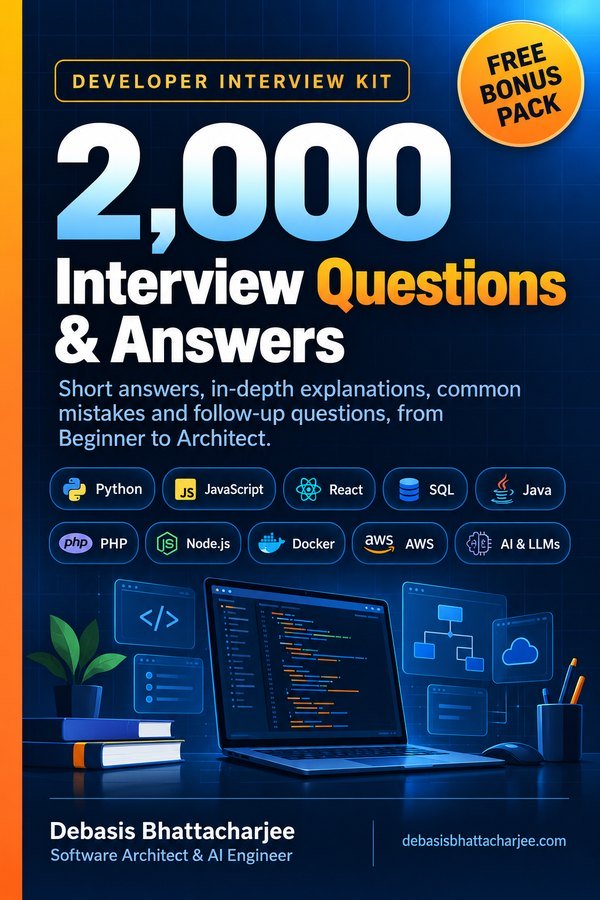
Developer Interview Kit · PDF

2,000 Interview Questions & Answers, in one PDF
- Short answers, in-depth explanations, common mistakes and follow-ups
- 89 topics, from Beginner to Architect, with a clickable contents list
- 226 extra questions that are not on this website
- Free Bonus Pack: 30-day study plan, behavioral questions, salary scripts
$7.99 one-time · instant email delivery
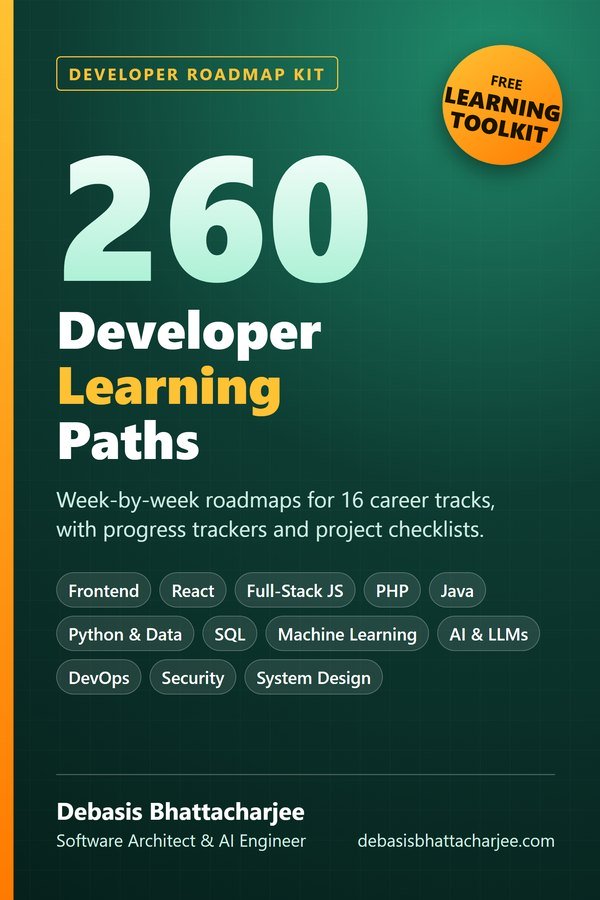
Also available: 260 Developer Learning Paths $4.99
Week-by-week roadmaps for 16 career tracks (Python, React, Java, DevOps, SQL, AI and more), with a progress tracker on every path.
See what's inside →
Get both books for $9.99 (save $2.99):
The material stays free to read online. This is the organised, offline, print-ready PDF edition. Secure payment by PayPal; your personal download link is emailed after payment is confirmed. Digital product, no shipping.