
I would use Seaborn for quick, high-level visualizations due to its appealing aesthetics and statistical capabilities, such as pair plots and heatmaps. Once I identify patterns and outliers, I’d switch to Matplotlib for more granular control, like customizing axes and adding annotations to specific data points.
In depth
Seaborn builds on Matplotlib and offers a simplified syntax for creating visually appealing and informative statistical graphics. In an exploratory data analysis (EDA) workflow, using Seaborn first allows for rapid visualization of complex datasets, making it easier to identify trends, correlations, and outliers at a glance. After exploring the data, Matplotlib comes in handy for fine-tuning these visuals. It provides extensive customization options, allowing alterations to figure dimensions, colors, labels, and more, which is crucial when preparing visuals for presentations or reports. Moreover, understanding the limitations of Seaborn is key; it might not handle all customizations needed for specific business requirements, thereby necessitating a transition to Matplotlib for detailed adjustments.
Example scenario
In a project analyzing sales data for a retail company, I initially used Seaborn to create pair plots and correlation heatmaps to visually assess relationships between variables such as price, promotions, and customer demographics. After identifying key trends, I then switched to Matplotlib to create detailed line charts, adding annotations to highlight significant sales peaks and seasonal trends. This dual approach enabled quick insights and refined presentation-quality graphics that were well-received by stakeholders.
Common mistakes
One common mistake is neglecting to explore data adequately with Seaborn before diving into Matplotlib for detailed visualizations. This can lead to missing important patterns or insights that could have informed more effective visual designs. Another mistake is not leveraging Seaborn's built-in statistical capabilities, such as regression or distribution overlays, which can add informative context to visualizations, making them more impactful. Sometimes, developers may try to replicate Seaborn's features in Matplotlib without realizing the latter is more complex and may require more time to achieve similar results.
Follow-up questions
- What are some advantages of using Seaborn over Matplotlib?
- Can you explain how you would handle missing data in visualizations?
- How do you optimize performance when rendering large datasets?
- What best practices do you follow for ensuring accessibility in your visualizations?
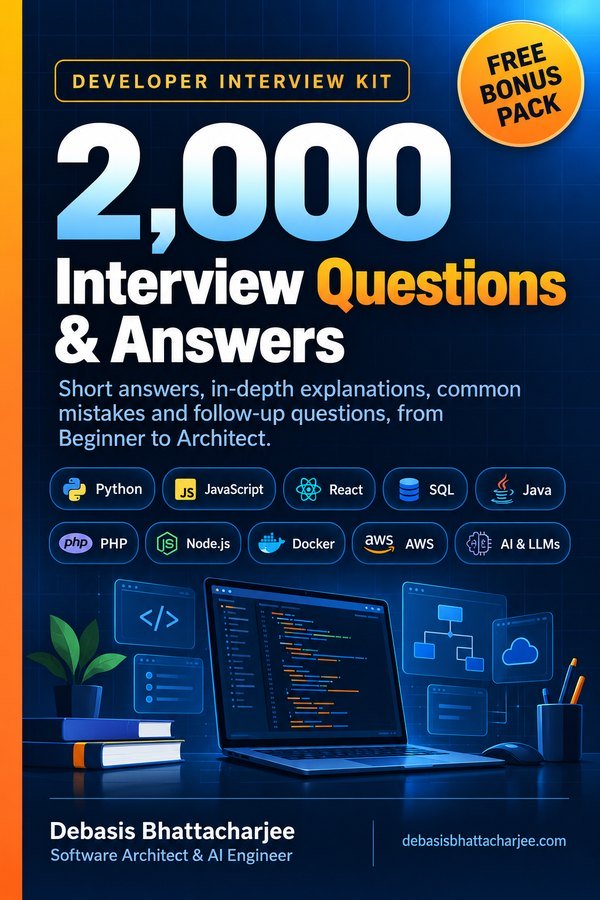
Want all 2,000 questions in one PDF?
- Short answers, in-depth explanations, common mistakes and follow-ups
- 89 topics, from Beginner to Architect, with a clickable contents list
- 226 extra questions that are not on this website
- Free Bonus Pack: 30-day study plan, behavioral questions, salary scripts
Includes 226 extra questions that are not on this site, plus a free Bonus Pack.

Get both books for $9.99 (save $2.99):
The material stays free to read online. This is the organised, offline, print-ready PDF edition. Secure payment by PayPal; your personal download link is emailed after payment is confirmed. Digital product, no shipping.