Overview
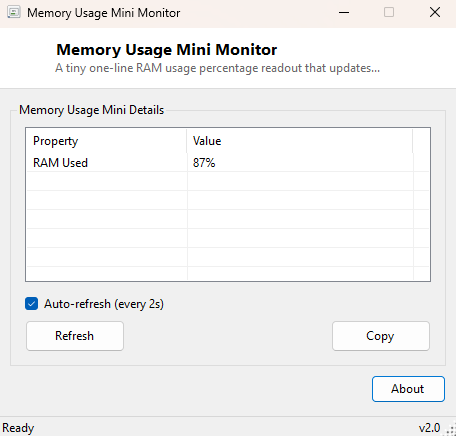
Memory Usage Mini Monitor strips RAM monitoring down to the smallest possible useful form: one line, one number, updated every second. Where a full system monitor gives you graphs, per-process breakdowns and a dozen other panels you have to scroll past, this tool exists for the much narrower moment when all you actually want is a persistent, glanceable percentage sitting in the corner of your screen while you work, game, or run something memory-hungry in the background. It is deliberately the smallest window on this entire site, both in pixel footprint and in scope.
The idea is simple: sometimes the full detail of a proper monitor is exactly what you do not want cluttering your desktop, and a single honest number is more useful than a dashboard you have to interpret. There are no axes to read, no colors to decode, and no history graph competing for your attention — just the current percentage, refreshed a moment ago, sitting quietly wherever you put the window.
This kind of minimal, single-purpose readout has a long history among Windows power users precisely because it solves a problem full dashboards create: the more information a monitor shows, the more attention it demands every time you glance at it. Memory Usage Mini Monitor deliberately refuses to grow beyond its original scope — it will never gain a graph, a settings panel, or a second metric, because the moment it does, it stops being the fastest possible way to answer one specific question.
Key Features
- A single live RAM usage percentage, nothing else on screen
- Updates every second for near-real-time feedback
- Tiny fixed window size designed to sit unobtrusively in a screen corner
- No graphs, no history, no configuration — just the number
- Zero measurable performance overhead of its own
Why You Might Need This Tool
Gamers and streamers who want a lightweight always-visible memory readout without the overhead of a full overlay suite are the most common audience — this tool costs almost nothing in CPU or memory itself, which matters when you are trying to monitor a system precisely because it is already under memory pressure. It is also handy during long compiles, video renders, or virtual machine sessions where RAM usage climbs steadily and you want early warning before the system starts paging heavily to disk and everything slows down. Because it is just one number with no interpretation required, it is also genuinely useful to leave running on a second monitor during a support call, so you can read a live figure over the phone without walking someone through opening Task Manager.
How It Works
Every second, the tool queries Win32_OperatingSystem via WMI for the
FreePhysicalMemory and TotalVisibleMemorySize properties,
both reported in kilobytes. Subtracting free from total gives used memory, and
dividing used by total gives the percentage displayed. This is the same underlying
data source several other, more detailed tools in this catalog use — the difference
here is purely presentation: instead of a table with total/used/free/percentage all
shown separately, this tool collapses everything down to the one number most people
actually glance at repeatedly.
How to Use It
Open the tool, optionally drag it to a screen corner, and leave it running. There are no settings to adjust and no menus to explore — the percentage updates itself every second for as long as the window stays open, and closing it stops monitoring immediately with no background process left behind.
System Requirements & Notes
Runs on 64-bit Windows 10 and 11 and requires no administrator rights, since reading aggregate memory statistics through WMI is a standard-user operation. The tool's own memory footprint is small enough that it does not meaningfully affect the percentage it is reporting.
Frequently Asked Questions
Can I resize the window or add more detail?
Not in this version — it is intentionally fixed and minimal. For a full breakdown of
total, used and free memory with more context, see
RAM Usage Monitor.
Does the percentage match exactly what Task Manager shows?
It should be extremely close, since both read from the same underlying Windows
memory counters; tiny momentary differences can occur simply because each tool
samples at a slightly different instant.
Will leaving this running affect my system's memory usage?
Its own footprint is minimal and effectively negligible compared to the totals it is
measuring, so it will not meaningfully skew the number it reports.
Why is there no warning color or alert when usage gets high?
By design — this tool reports, it does not editorialize. Adding thresholds and
alert colors would mean maintaining opinions about what counts as "too high" across
every possible system configuration, which varies enormously by installed RAM and
workload; the raw number lets you apply your own judgment instead.