Overview
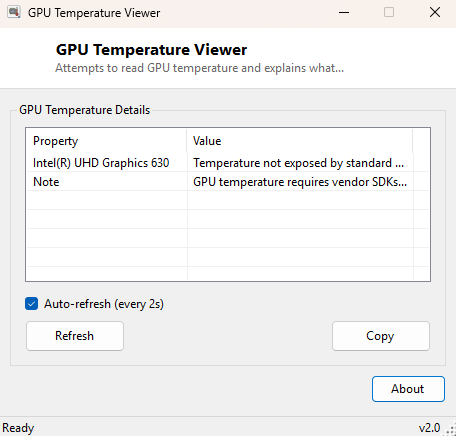
GPU Temperature Viewer sets out to answer one of the most commonly asked hardware questions on any Windows PC — "how hot is my graphics card running right now?" — and, in doing so, it also demonstrates one of the more honest lessons in this entire catalog: Windows itself simply does not expose that number through any standard, documented API. This tool queries every video controller it can find and reports exactly what is and is not available, rather than quietly faking a plausible-looking temperature reading the way some less careful utilities do.
Rather than being a dead end, this makes GPU Temperature Viewer a genuinely useful diagnostic starting point: it correctly enumerates every GPU in the system by name, confirms Windows Management Instrumentation is functioning correctly, and then gives you a clear, accurate explanation of why the temperature field is empty and what you would need to install to actually see it.
Key Features
- Lists every installed graphics adapter by its full driver-reported name
- Auto-refreshing view with a toggleable live-update timer
- One-click Copy button to place the full report on the clipboard
- Clear, honest explanation of why GPU temperature is not shown
- No third-party driver, hook, or background service installed
- Instant startup with zero configuration
Why You Might Need This Tool
People reach for a GPU temperature reader most often while troubleshooting a thermal problem — unexpected fan noise, a game stuttering under load, or a laptop that feels hot to the touch during a video call. Before assuming a monitoring tool is broken or missing a feature, it helps to understand precisely what Windows can and cannot tell any application about your graphics hardware without vendor-specific software. This tool exists to make that limitation obvious immediately, saving you time spent hunting through a dozen freeware "GPU monitors" that either silently fail or display a fabricated number pulled from nowhere.
How It Works
The tool queries Win32_VideoController through WMI, which reliably
returns each adapter's Name property — the exact same class every other
GPU-related tool in this catalog (GPU Driver Version Checker, GPU Resolution
Checker) relies on for identification. However, Win32_VideoController
has no temperature field, and no other standard, undocumented-free Windows WMI class
exposes one either. Real-time GPU temperature is only available through each
manufacturer's own proprietary interface — NVIDIA's NVAPI, AMD's ADL (now ADLX), or
Intel's iGCL — none of which ship with Windows and each of which requires
vendor-specific linking that this catalog deliberately avoids in order to keep every
tool small, dependency-free and universally compatible across hardware brands. The
tool therefore lists each adapter alongside a clear note explaining exactly this
limitation, rather than pretending otherwise.
How to Use It
Launch the program and it immediately lists every detected graphics adapter along with the temperature-availability note. Click Refresh at any time to re-query the system (useful after installing or removing a GPU), or leave auto-refresh enabled to catch adapter changes automatically. Use Copy to paste the full report into a support ticket or forum post when you need to show someone exactly what adapters Windows sees.
System Requirements & Notes
Runs on 64-bit Windows 10 and Windows 11 and requires no administrator rights, since
reading Win32_VideoController is available to any standard user account.
For actual temperature monitoring, install your GPU vendor's own control panel
(NVIDIA App, AMD Software, or Intel Graphics Command Center) or a dedicated
third-party sensor tool built against the relevant vendor SDK.
Frequently Asked Questions
Why doesn't this tool just show a temperature like other monitoring apps?
Because Windows' built-in WMI classes genuinely do not expose GPU temperature. Tools
that show a number are either bundling a vendor SDK or reading a value from a
background service that is already running for another reason.
Does this work with multiple GPUs (integrated + dedicated)?
Yes — every adapter WMI reports, including integrated graphics, appears as a
separate row.