Overview
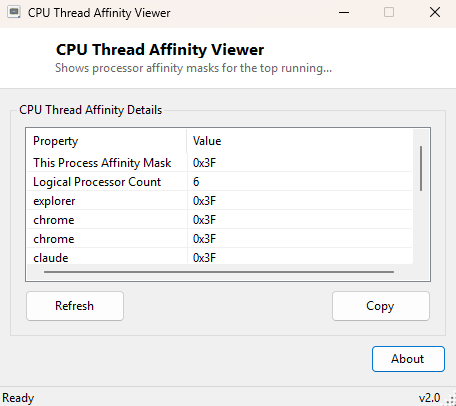
CPU Thread Affinity Viewer shows which logical processors each running program is currently allowed to use. Windows lets any process be restricted, either by itself or by an administrator, to a specific subset of the machine's logical CPU cores — this restriction is called processor affinity, and it is represented internally as a bitmask where each bit corresponds to one logical processor. Most programs never touch this setting and are free to run on any core, but the ones that do set a custom affinity mask can behave very differently in terms of performance, and diagnosing that behavior requires actually seeing the mask, not guessing at it.
This tool reads and displays that mask for the current process and for the top processes on the system by memory usage, presented in hexadecimal so each set bit maps directly and legibly to a specific logical core index.
Key Features
- Shows this tool's own processor affinity mask as a baseline reference example
- Reports the total logical processor count for context when interpreting any mask
- Lists the ten heaviest running processes by working-set memory, each with its affinity mask
- Displays every mask in hexadecimal, matching how affinity is set via Task Manager's "Set Affinity" dialog or the
start /affinitycommand - Copy button to export the full list for a support ticket or performance investigation
- Gracefully skips any process it cannot query due to access restrictions rather than failing the whole scan
Why You Might Need This Tool
Processor affinity issues show up in specific, recognizable ways: a program that should be using every core on the machine but is stuck at a fraction of expected performance, a background task pinned to a single core by a well-meaning but outdated compatibility workaround, or a virtualization or security tool that quietly restricted a process's affinity as part of its own sandboxing. Task Manager's own "Set Affinity" dialog lets you change a mask but does not give you a scannable overview of what every running process is currently set to; this tool exists specifically to answer "what is actually restricted right now, across everything running" in one glance rather than checking processes one at a time through right-click menus.
How It Works
The tool calls Process.GetCurrentProcess() and reads its
ProcessorAffinity property — a .NET-managed wrapper around the same
underlying Win32 affinity mask Windows itself tracks per process — and formats it in
hexadecimal alongside Environment.ProcessorCount for the total logical
core count. It then calls Process.GetProcesses() to enumerate every
running process, orders them by WorkingSet64 (physical memory currently
in use) descending, takes the top ten, and reads each one's
ProcessorAffinity property in the same way. Processes owned by another
user account or protected by the OS will throw an access-denied exception when their
affinity is queried; the tool catches that per-process and simply skips the entry
rather than stopping the whole scan, so one inaccessible system process never
prevents you from seeing the rest of the list.
How to Use It
Launch the tool and the list populates immediately with the current top ten processes by memory and their affinity masks, plus the tool's own mask and the total logical processor count as a reference. Click Refresh to re-scan after starting or stopping other programs, or Copy to save the full list to the clipboard.
System Requirements & Notes
Runs on 64-bit Windows 10/11 and does not require administrator rights to read affinity for processes owned by the same user account; processes owned by other accounts or running with elevated system privileges are simply skipped rather than causing an error, as noted above.
Frequently Asked Questions
What does a mask like 0xFF mean?
Each bit represents one logical processor, numbered from bit 0 upward. 0xFF is
binary 11111111, meaning logical processors 0 through 7 are all allowed — the
process is free to run on any of the first eight cores/threads.
Can I change a process's affinity with this tool?
No, this is a read-only viewer. To change affinity, use Task Manager's Details tab,
right-click a process, and choose "Set affinity."
Why can't I see affinity for every single process on my system?
The tool intentionally limits itself to the ten heaviest processes by memory to keep
the results focused and readable; a handful of system-owned processes will also be
skipped automatically if access is denied.