Overview
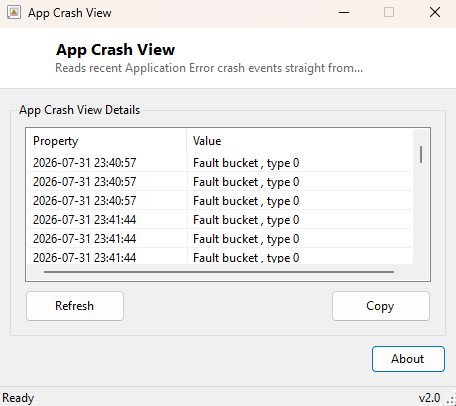
App Crash View reads the Windows Application event log directly and lists recent application crash events — the same Application Error entries Windows Error Reporting logs every time a desktop program terminates unexpectedly — without needing to open the full Event Viewer console and manually filter down to the right log, source and event ID.
Key Features
- Reads Application Error events (IDs 1000 and 1001) straight from the Event Log
- Shows the timestamp and a clean first-line summary of each crash
- Lists up to the 30 most recent matching events, newest first
- No need to navigate Event Viewer's log tree or configure a custom filter
- Refresh button to re-scan for newly logged crashes without restarting the tool
Why You Might Need This Tool
When an application crashes and simply vanishes without a visible error dialog — or shows a generic "has stopped working" message with no useful detail — the actual crash information Windows captured is sitting in the Event Log the whole time, just buried several clicks deep inside Event Viewer's tree of logs and filters. App Crash View skips straight to that data. It is especially useful when trying to determine whether a series of crashes are the same recurring issue (matching faulting module names) or unrelated one-off incidents, and for gathering the exact timestamp and description text a support request or bug report needs.
How It Works
The tool builds an EventLogQuery against the "Application" log using an XPath
filter — *[System[(EventID=1000 or EventID=1001)]] — which targets exactly
the two event IDs Windows Error Reporting uses for standard application crashes (1000)
and non-fatal application hangs/errors (1001), via the
System.Diagnostics.Eventing.Reader namespace's EventLogReader
class. It reads events one at a time with reader.ReadEvent(), stopping once
it has collected 30 matches or run out of events, and for each one calls
rec.FormatDescription() to render the same human-readable description text
Event Viewer itself would show — the first line of which (containing the faulting
application and module) is extracted and displayed alongside the event's
TimeCreated timestamp. If description formatting fails for a particular
event (which can happen for entries whose message-resource DLL isn't available), the tool
falls back to a placeholder rather than crashing itself.
How to Use It
Launch the tool and the 30 most recent Application Error/crash events load automatically, newest first. Click Refresh after reproducing a crash to pull the latest entry into the list without restarting the tool.
System Requirements & Notes
Reading the Application event log as the current user does not require administrator rights on a standard Windows configuration. If your organization has restricted Event Log read access via Group Policy, this tool will be limited by the same restriction as Event Viewer itself.
Frequently Asked Questions
Does this show crashes from before the tool was installed?
Yes — it reads whatever the Application log already contains, which on a typical system
covers recent history subject to the log's configured maximum size and retention.
Can I see the full crash dump or stack trace here?
No — App Crash View shows the same summary description Event Viewer displays, not a full
memory dump. For deeper minidump analysis, a dedicated crash-dump debugger would be
needed; this tool is aimed at quickly confirming that a crash happened and identifying
which module was involved.