Network Monitor ++
Monitor network usage, connected devices and internet speed in real time
Network Monitor++ tracks your Windows network in real time — live upload/download speed, per-application bandwidth usage, connected devices on your LAN, internet latency and packet loss, and connection history.
See Network Monitor++ in Action
A clean, modern interface designed for real-world use.
Networkinfomonitor screen 01 screenshot
What Is Network Monitor++?
Network Monitor++ is a real-time network diagnostics and monitoring desktop application for Windows. It puts your entire network picture on one screen — live bandwidth, active connections, ping latency, DNS records, routing tables, local device scans, port checks and more — all updating continuously without you touching a browser or opening a command prompt. Whether you are troubleshooting a slow connection, auditing which processes are phoning home, or just curious what your network is doing right now, Network Monitor++ gives you the answer in seconds.
The app runs entirely locally. There is no cloud account, no telemetry, no subscription. Install it once and it works offline, on any Windows 10 or Windows 11 machine.
Screen-by-Screen Feature Walkthrough
1. The Command Centre Dashboard
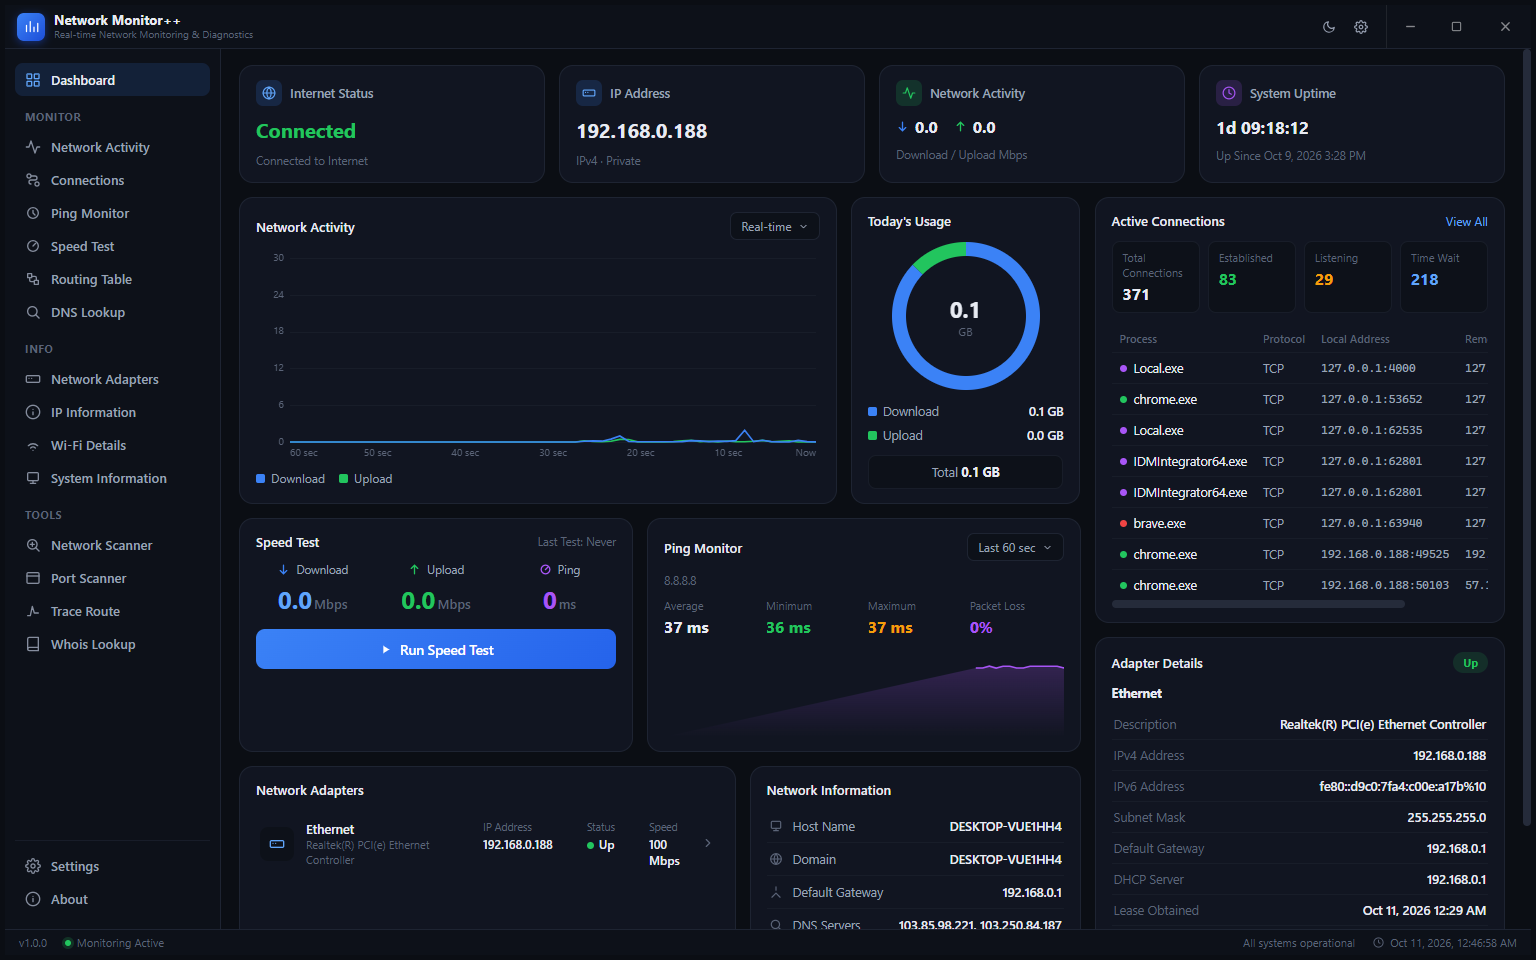
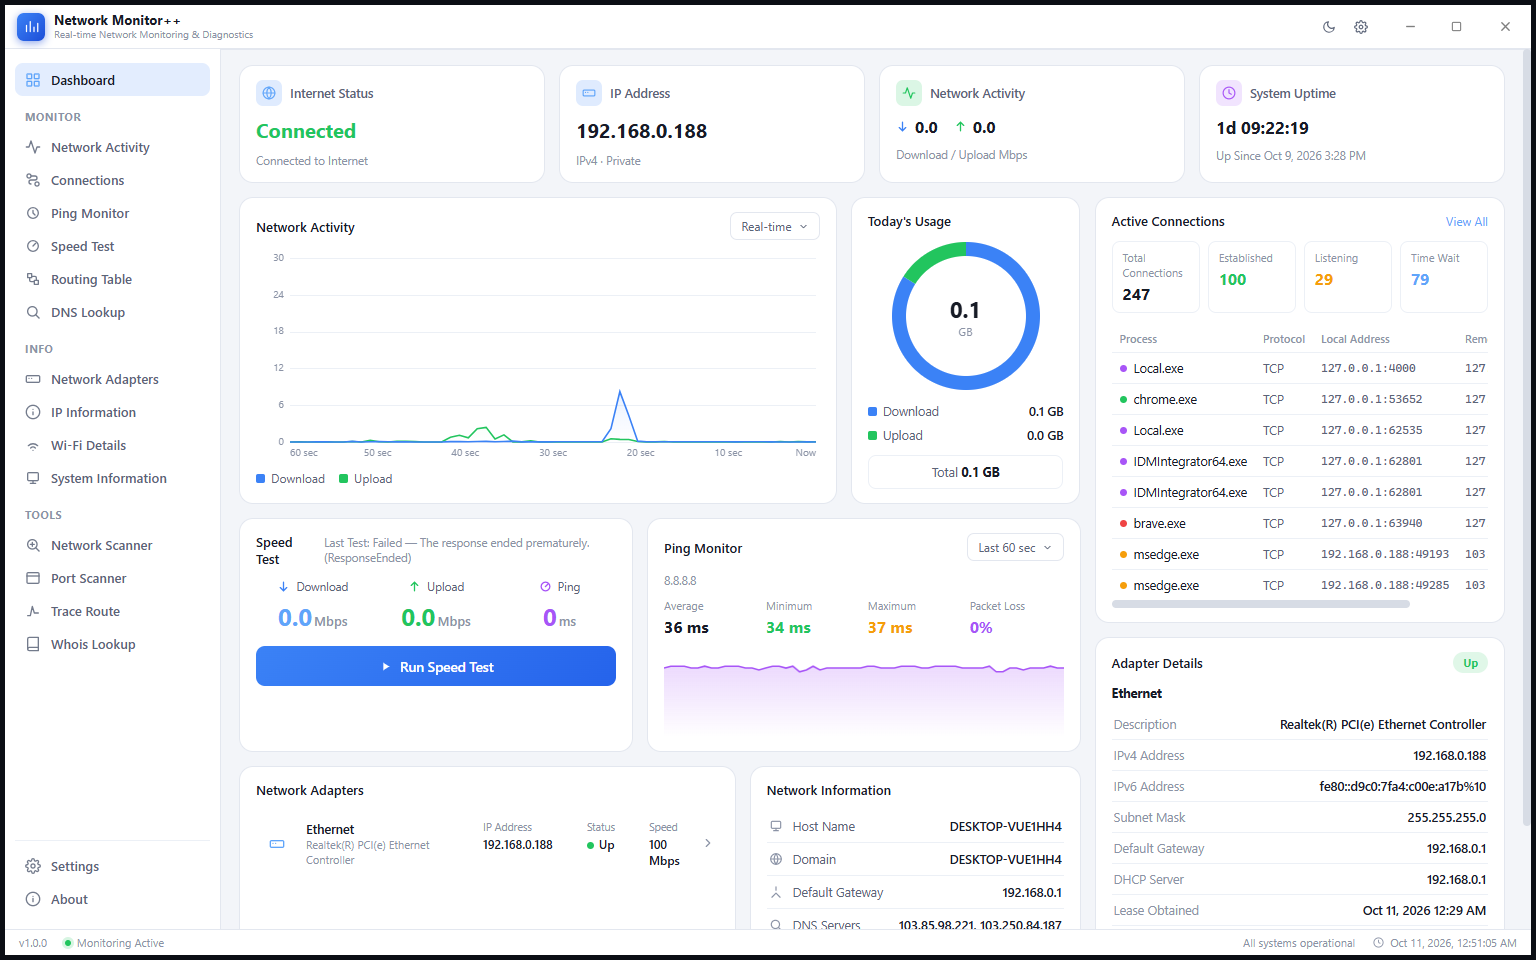
The Dashboard is the first screen you see on launch, and it is designed to answer the most common questions at a glance. Four summary cards across the top show Internet Status (Connected or Disconnected), your current IPv4 address, real-time download and upload speeds in Mbps, and system uptime down to the second. Below those, a full-width Live Throughput chart plots the last 60 seconds of download and upload traffic as separate colour-coded lines — blue for download, green for upload — so you can immediately see whether a bandwidth spike happened 10 seconds or 50 seconds ago.
The lower half of the dashboard is split into three columns. Today’s Usage shows a donut chart of total bytes transferred since midnight, with separate download and upload segments. Active Connections shows a live count broken into four states — Total, Established, Listening and Time Wait — along with a scrollable table of the processes currently holding open connections, their protocol, local address and remote address. The right column shows Adapter Details for your primary network interface: description, IPv4 and IPv6 addresses, subnet mask, default gateway, DHCP server and lease timestamps. Every number on this screen refreshes automatically — there is no refresh button to press.
2. Network Activity — Live Throughput
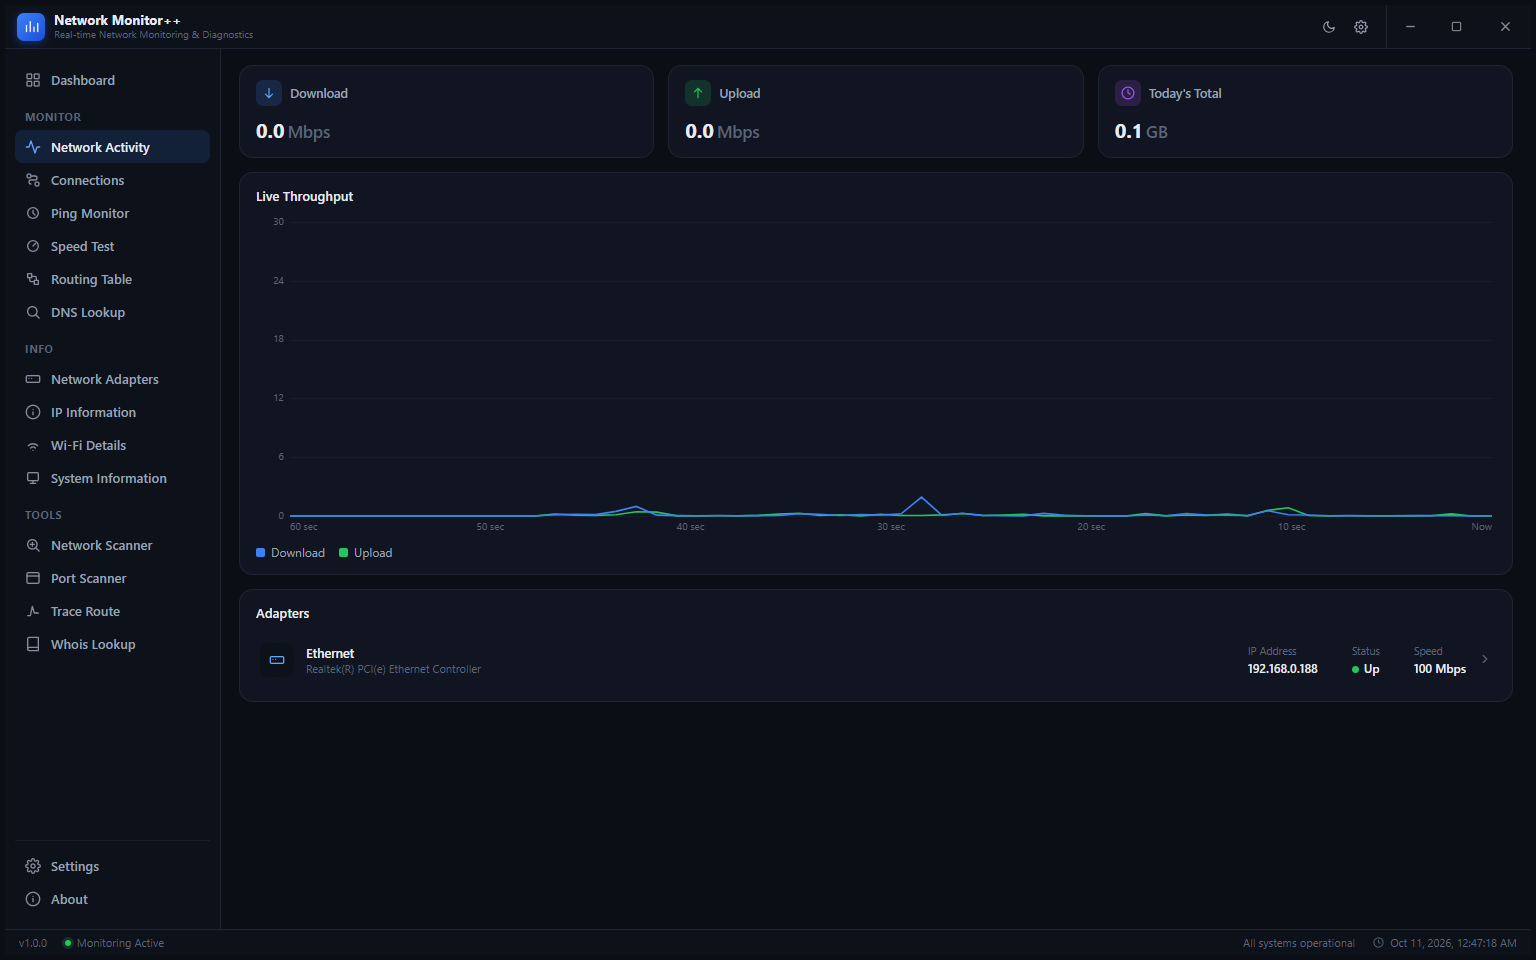
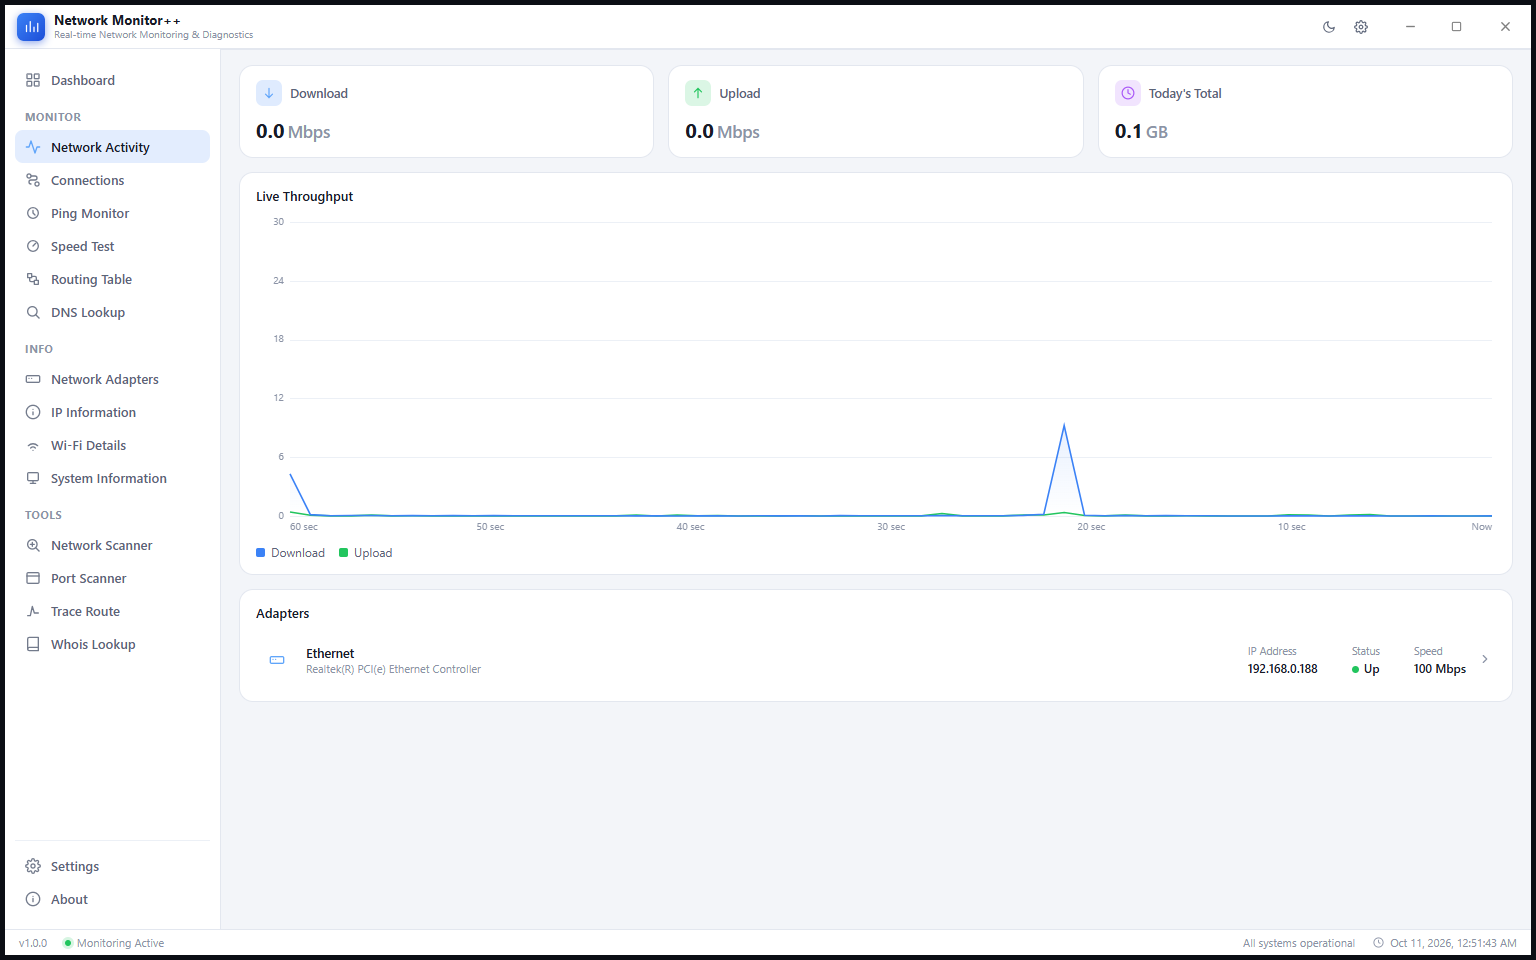
The dedicated Network Activity page expands the dashboard’s throughput chart into a full-screen view. Three metric cards at the top show current Download speed, Upload speed and Today’s Total data transferred. The Live Throughput chart below plots the complete 60-second rolling window with labelled time marks — 60 sec, 50 sec, 40 sec down to Now — so you can see exactly when a burst of activity occurred and how long it lasted. Below the chart, the Adapters panel lists every network interface detected on the machine with its IP address, status indicator and link speed. Clicking an adapter row would filter the throughput data to that adapter’s traffic alone.
3. Active Connections
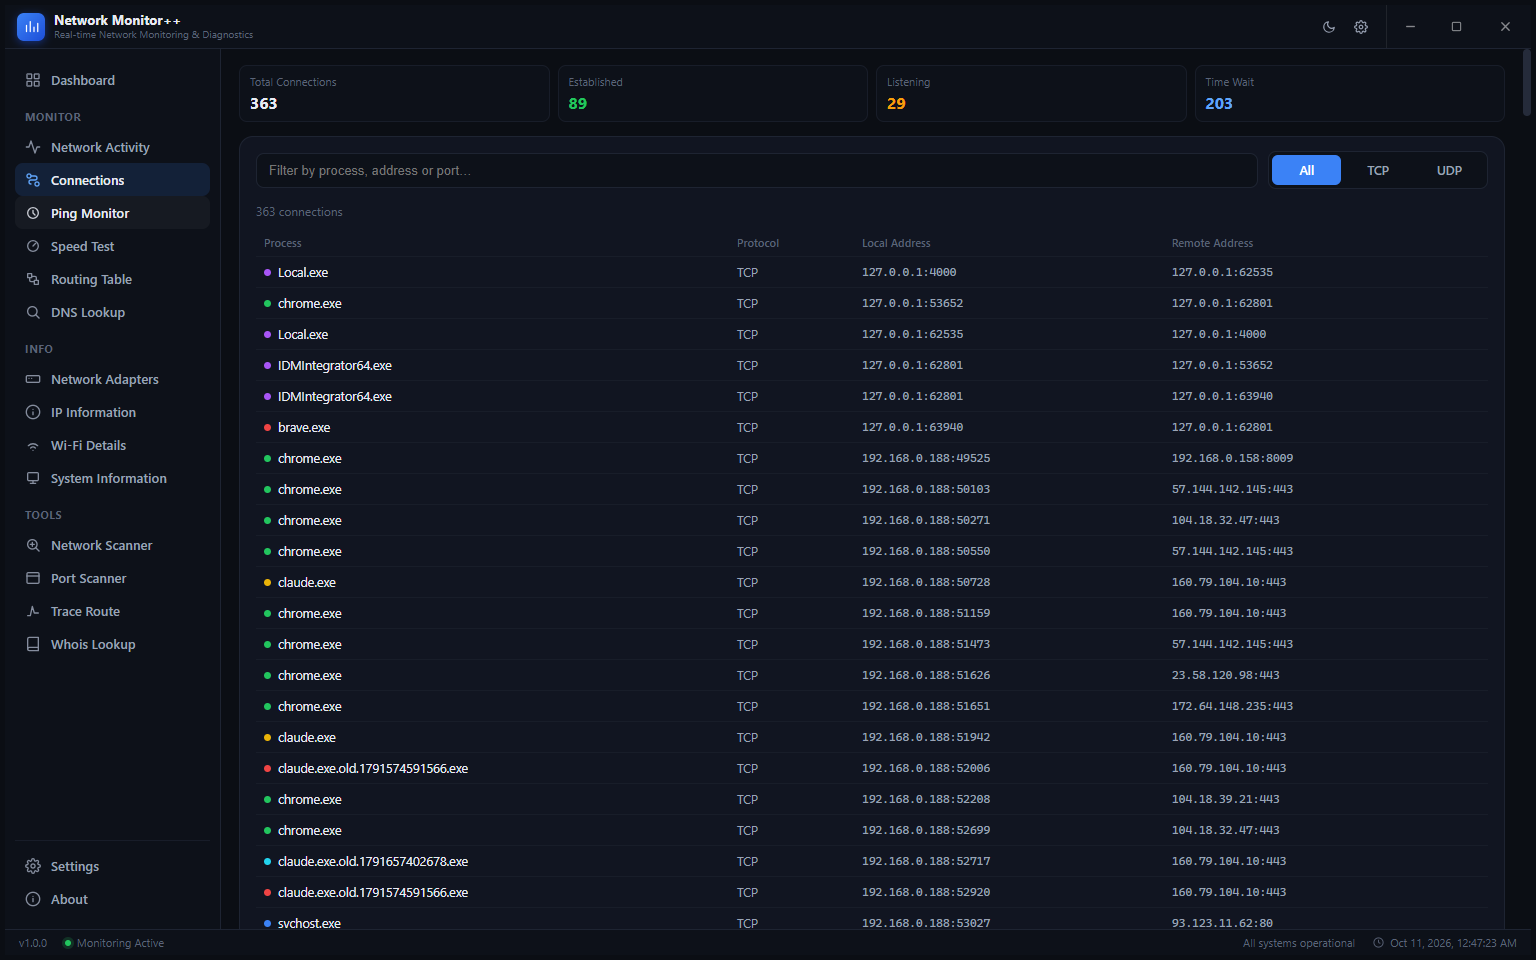
The Connections page is where you find out exactly what every process on your machine is doing on the network. The four counter chips at the top — Total Connections, Established, Listening and Time Wait — update live. Below them, a filter bar lets you search by process name, IP address or port number instantly; the table refreshes as you type. Three tabs — All, TCP, UDP — let you narrow the view by protocol. The main table shows every active connection as a row: process name with a colour-coded status dot, protocol, local address and port, and remote address and port. In the screenshot, 363 connections are open across processes including chrome.exe, claude.exe, IDMIntegrator64.exe, brave.exe and svchost.exe. This is the fastest way to spot an unexpected process opening connections to the internet.
4. Ping Monitor — Continuous Latency Tracking
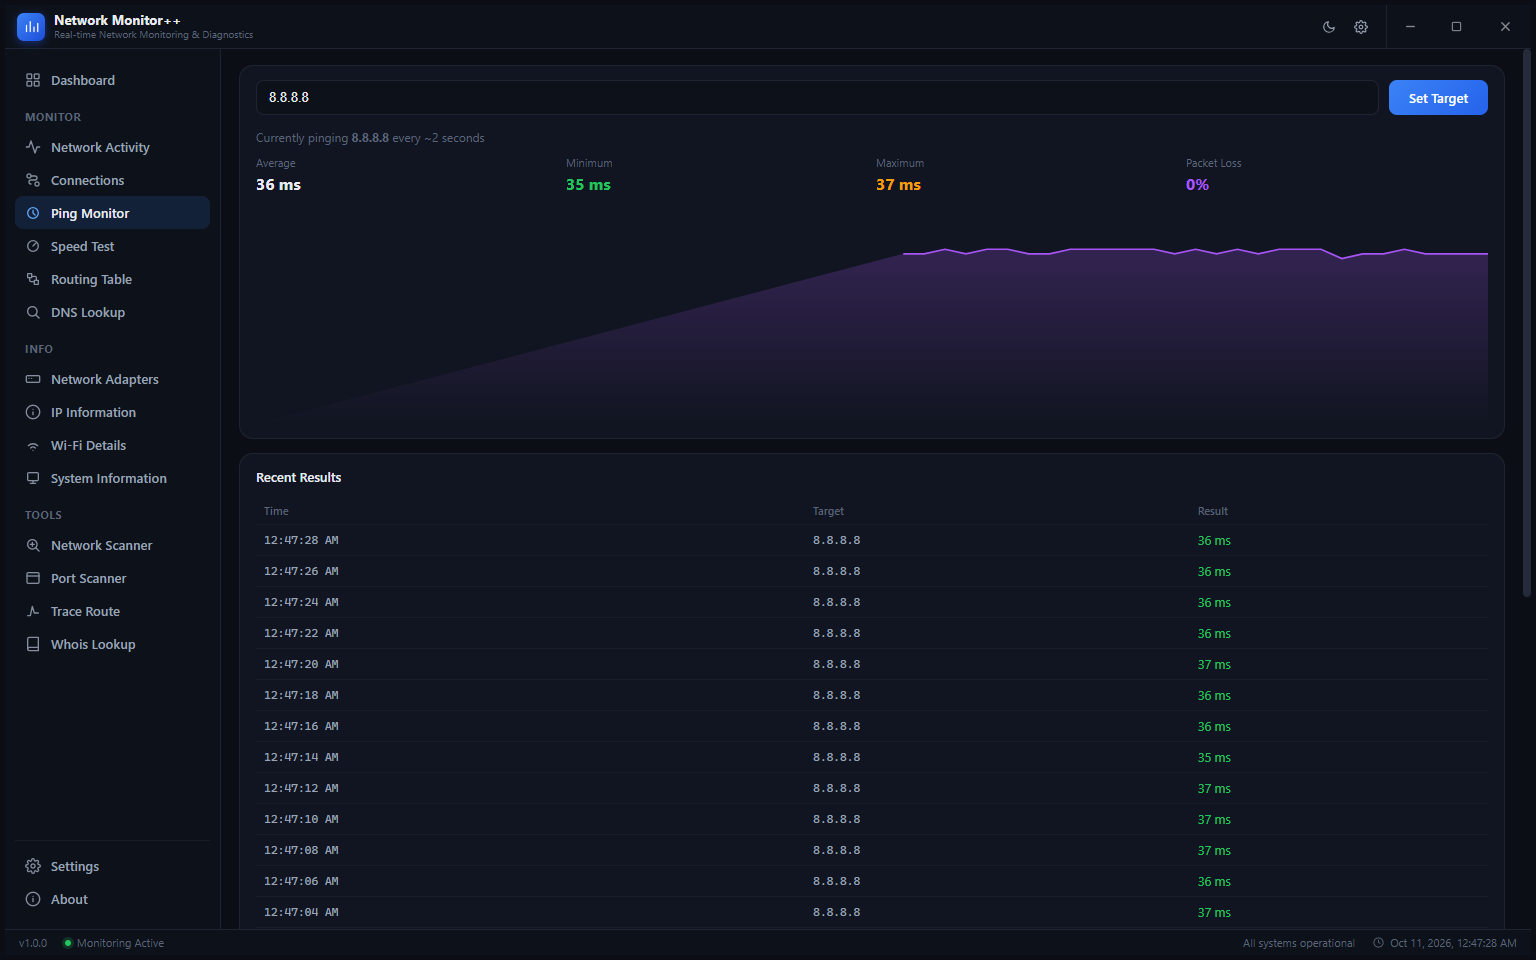
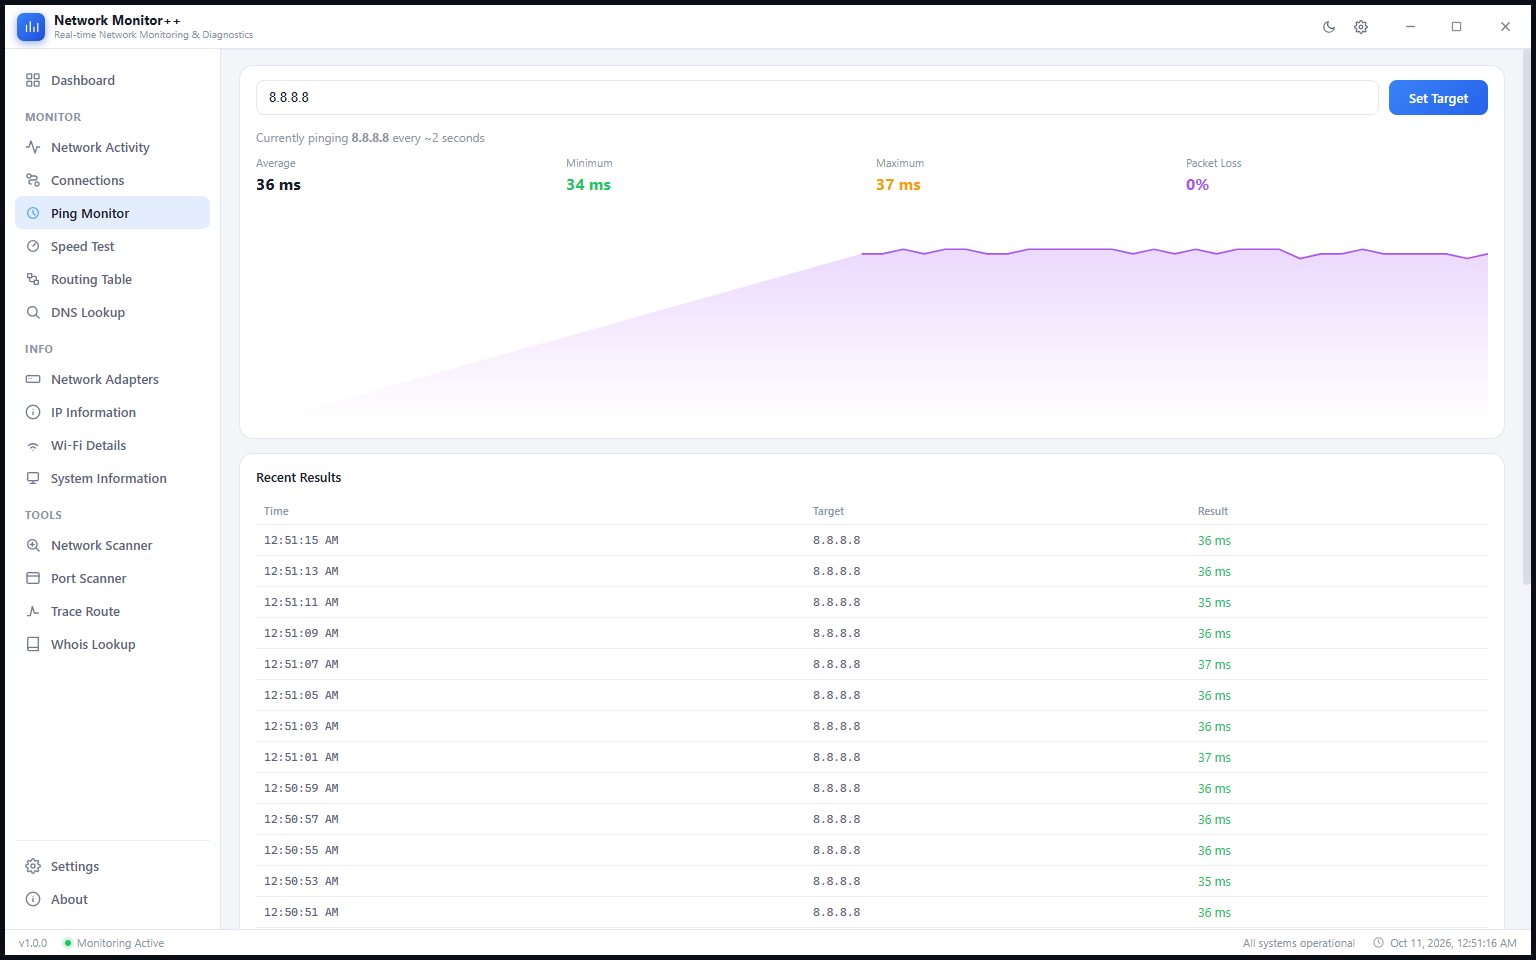
Ping Monitor runs a continuous ping to any host you choose, updating every two seconds. The target field at the top lets you switch from the default 8.8.8.8 (Google DNS) to any domain or IP — your router, a game server, your work VPN endpoint. Four stat cards show Average, Minimum, Maximum and Packet Loss across the monitoring session. The large area chart below plots every ping result as a continuous waveform — flat means stable, spikes mean jitter, gaps in the line mean packet loss. The Recent Results table beneath the chart logs every individual ping with its exact timestamp, target and result in milliseconds, giving you a timestamped record you can scroll back through to identify when latency degraded.
5. Speed Test
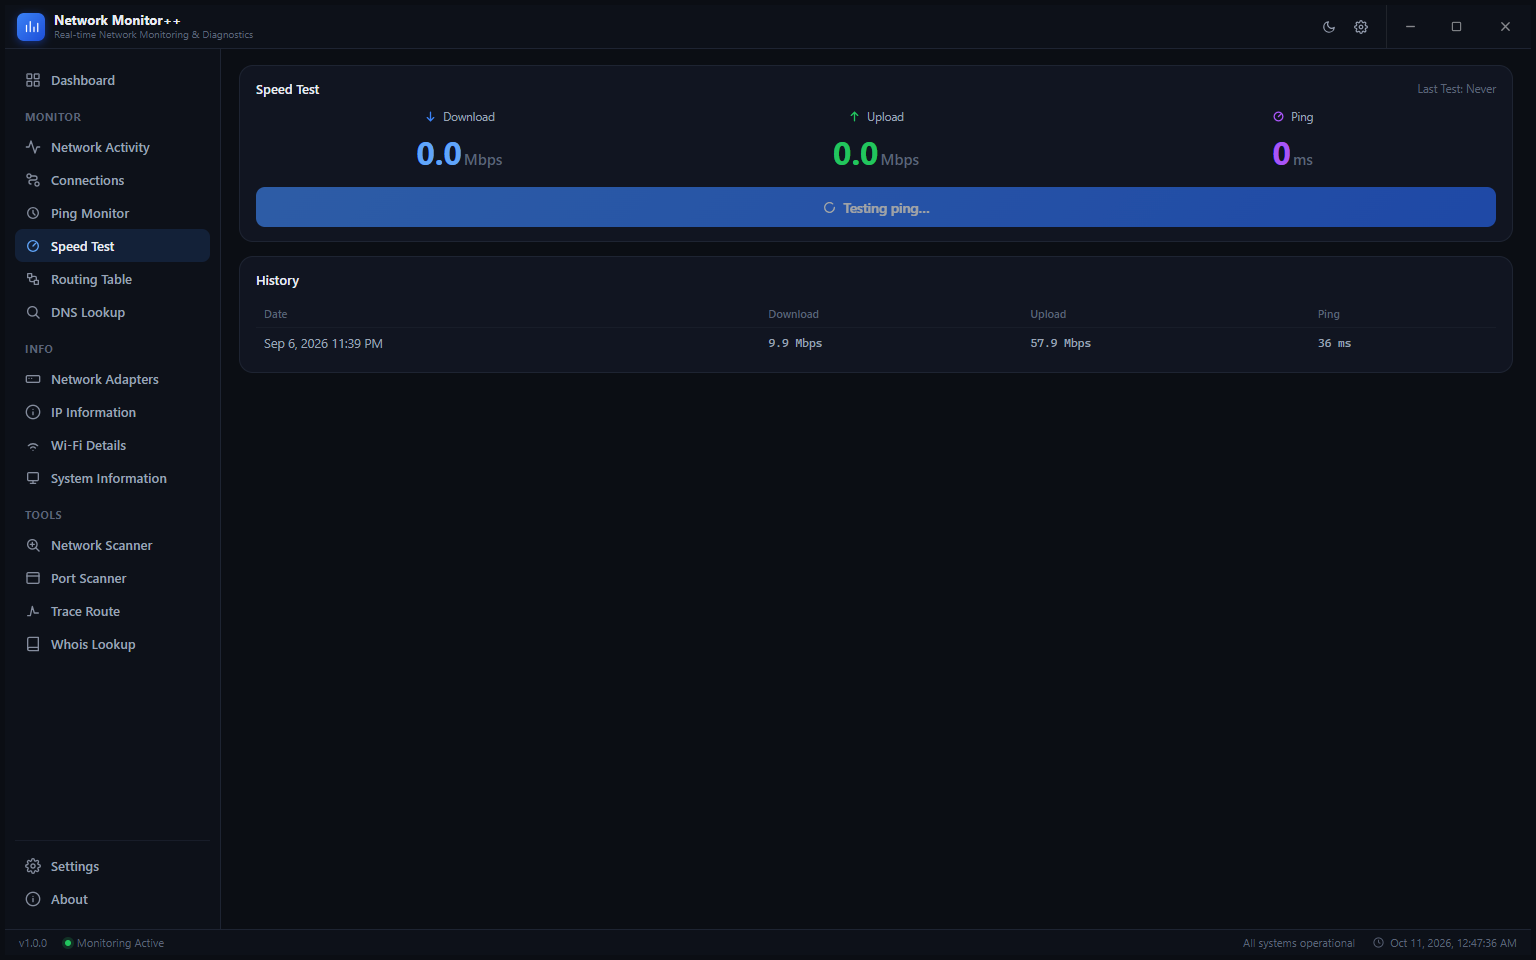
The Speed Test page measures your actual internet speed — download, upload and ping — on demand. Clicking Run Speed Test starts the test and the status label updates through each phase: Testing ping, then measuring download, then upload. Previous test results are saved in the History table at the bottom with the date, download speed, upload speed and ping for each run, so you can compare today’s result against last week’s without keeping a spreadsheet. The screenshot shows a test in progress, with a previous result of 9.9 Mbps download and 57.9 Mbps upload from the same machine.
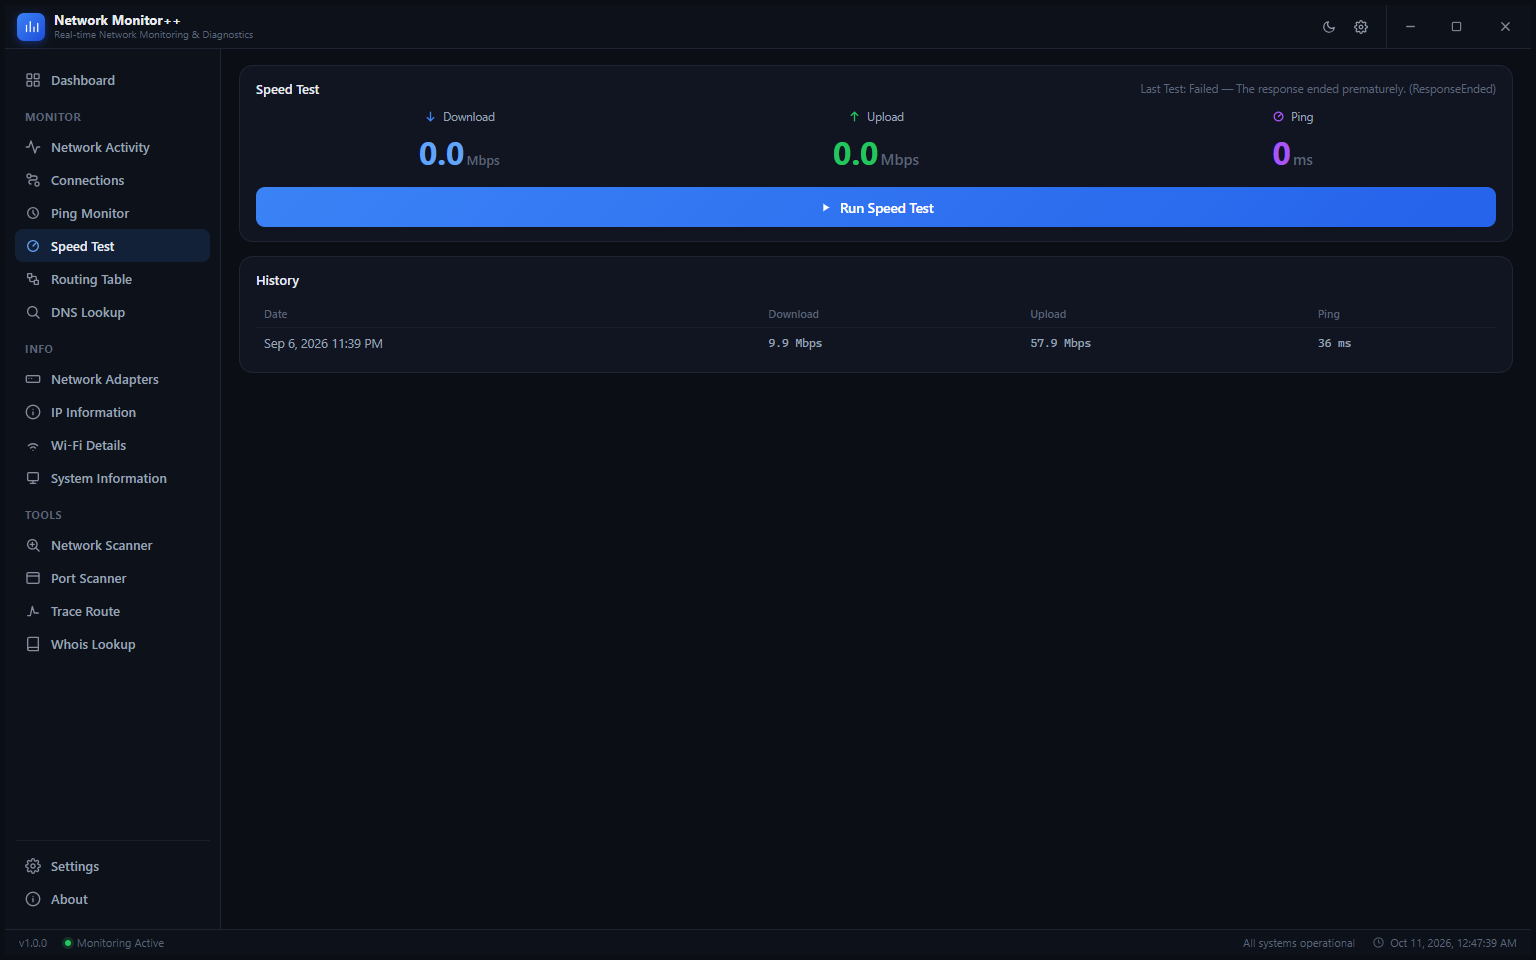
If a speed test fails — for example, because the test server was unreachable — the header shows the exact failure reason and the button returns to Run Speed Test so you can retry immediately. The History table retains all previous valid results regardless of the most recent outcome.
6. Routing Table
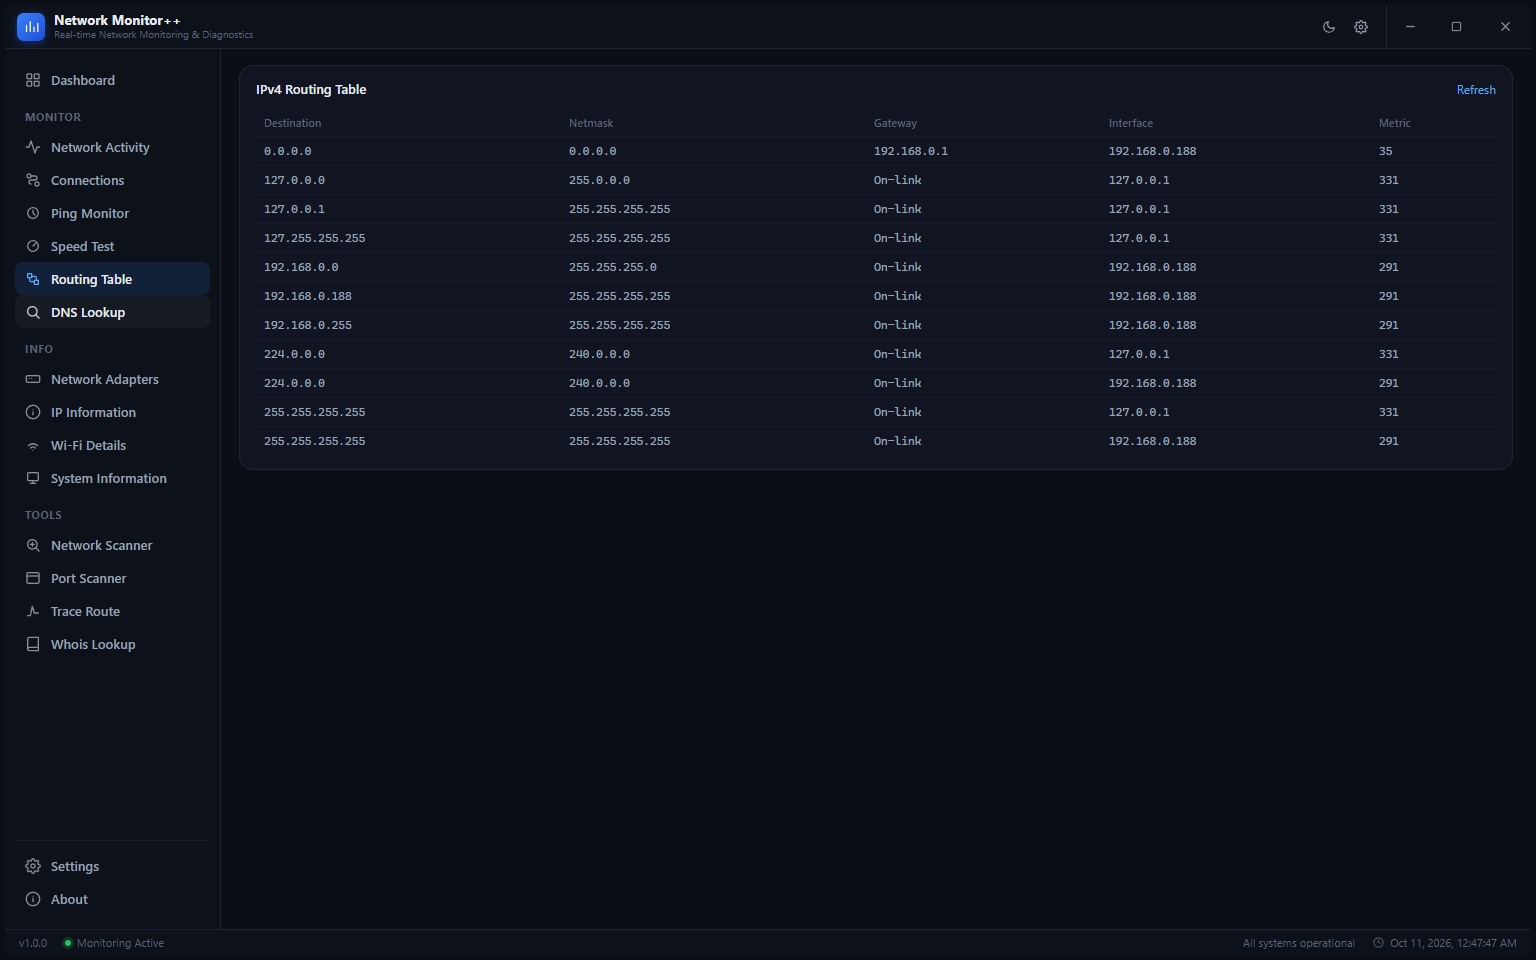
The Routing Table page reads your machine’s IPv4 routing table and displays it in a clean, readable grid. Each row shows the Destination network, Netmask, Gateway, Interface and Metric. On this machine the table shows the default route (0.0.0.0) pointing to the gateway at 192.168.0.1 via the Ethernet interface, loopback entries for 127.x.x.x addresses, local subnet routes and multicast routes. A Refresh button at the top right re-reads the table on demand. This view is useful when diagnosing routing issues — a missing or wrong gateway entry is immediately visible.
7. DNS Lookup — Any Record Type
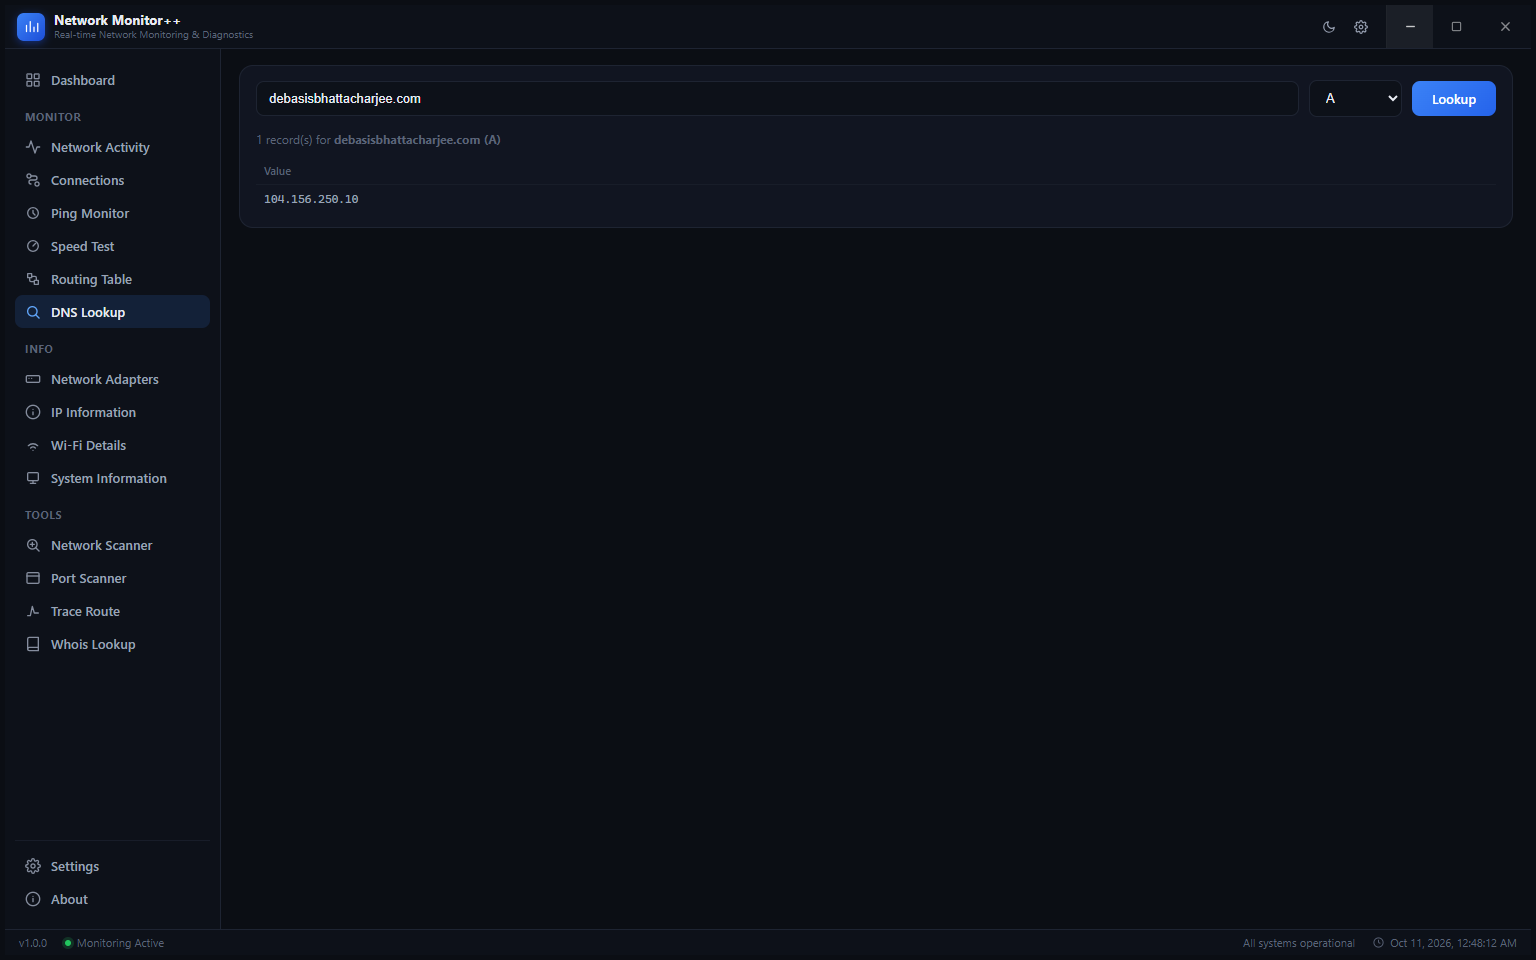
The DNS Lookup tool queries any domain for any record type without leaving the app. Type a domain in the search field, choose a record type from the dropdown — A, MX, NS, TXT, CNAME, AAAA and more — and click Lookup. Results appear instantly below. The screenshot shows an A record query for debasisbhattacharjee.com returning 104.156.250.10.
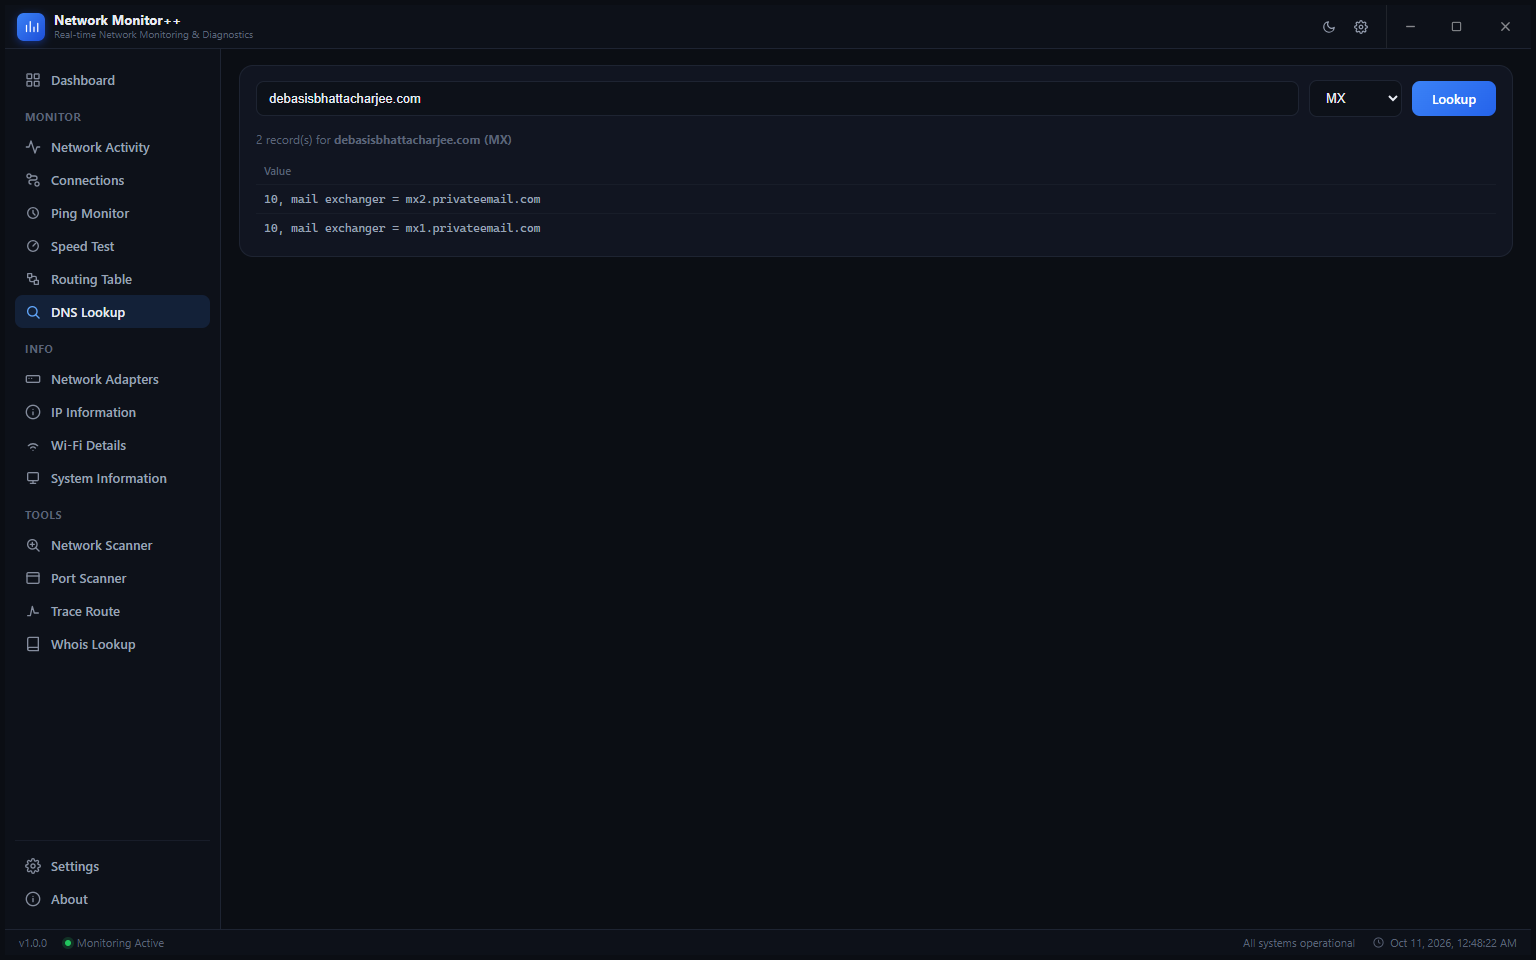
Switching the record type to MX shows the mail exchange records for the same domain — in this case two entries pointing to mx1 and mx2.privateemail.com, both with priority 10. You can run multiple different queries for the same domain one after another by changing the dropdown and clicking Lookup again.
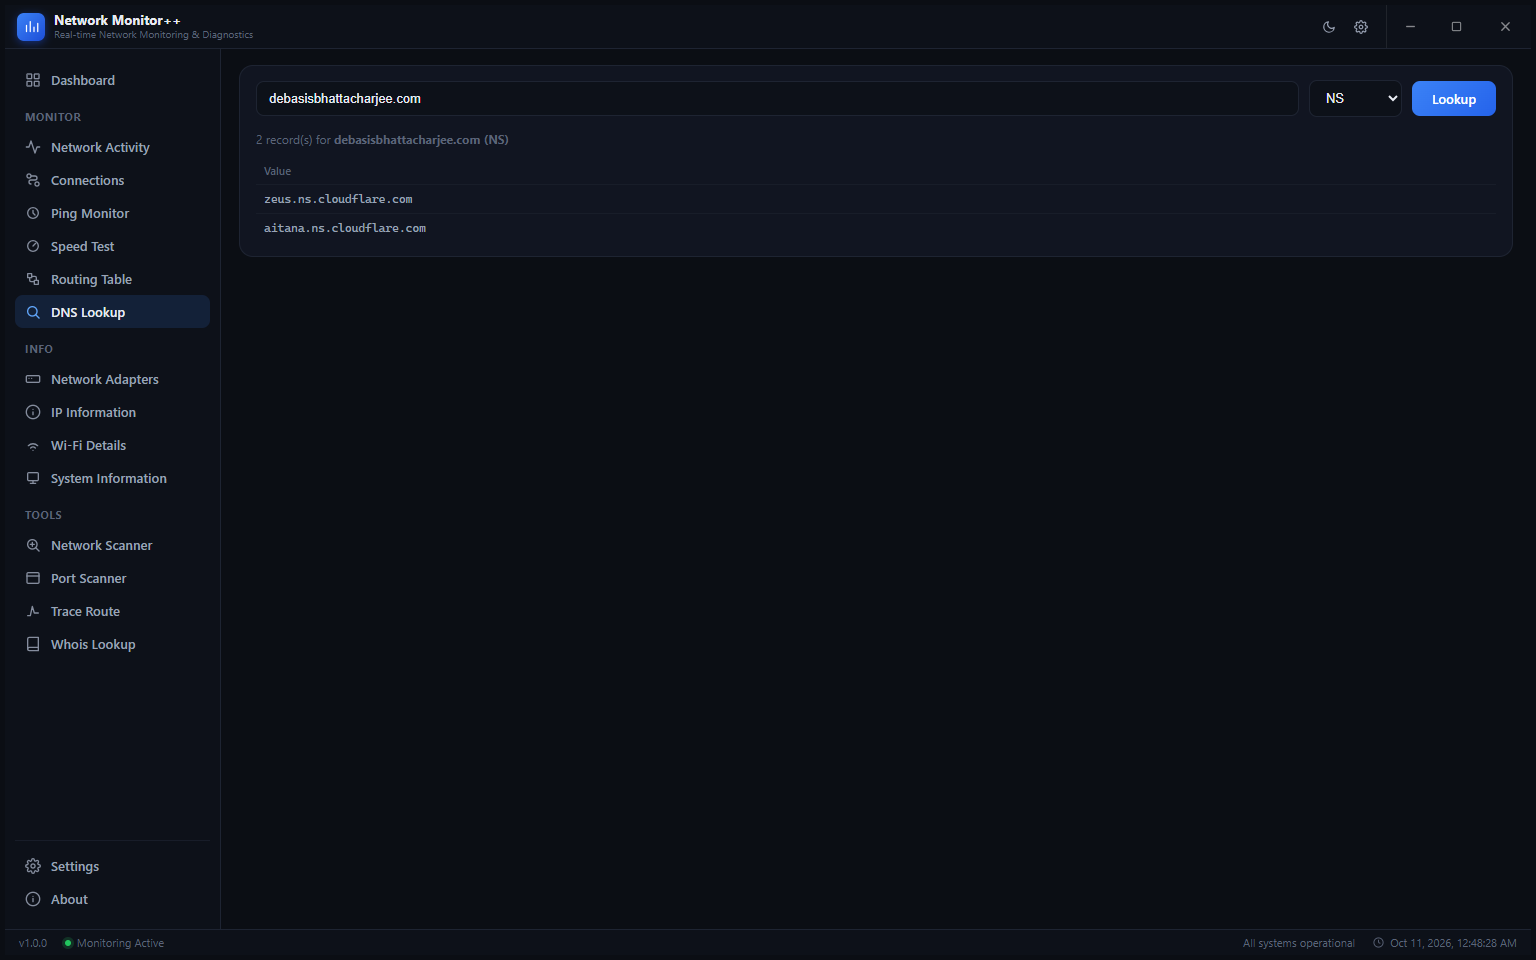
An NS record query shows the nameservers authoritative for the domain — here zeus.ns.cloudflare.com and aitana.ns.cloudflare.com, confirming the domain’s DNS is managed through Cloudflare. DNS Lookup is useful for verifying propagation after a DNS change, debugging email delivery problems or checking where a domain actually resolves.
8. IP Information
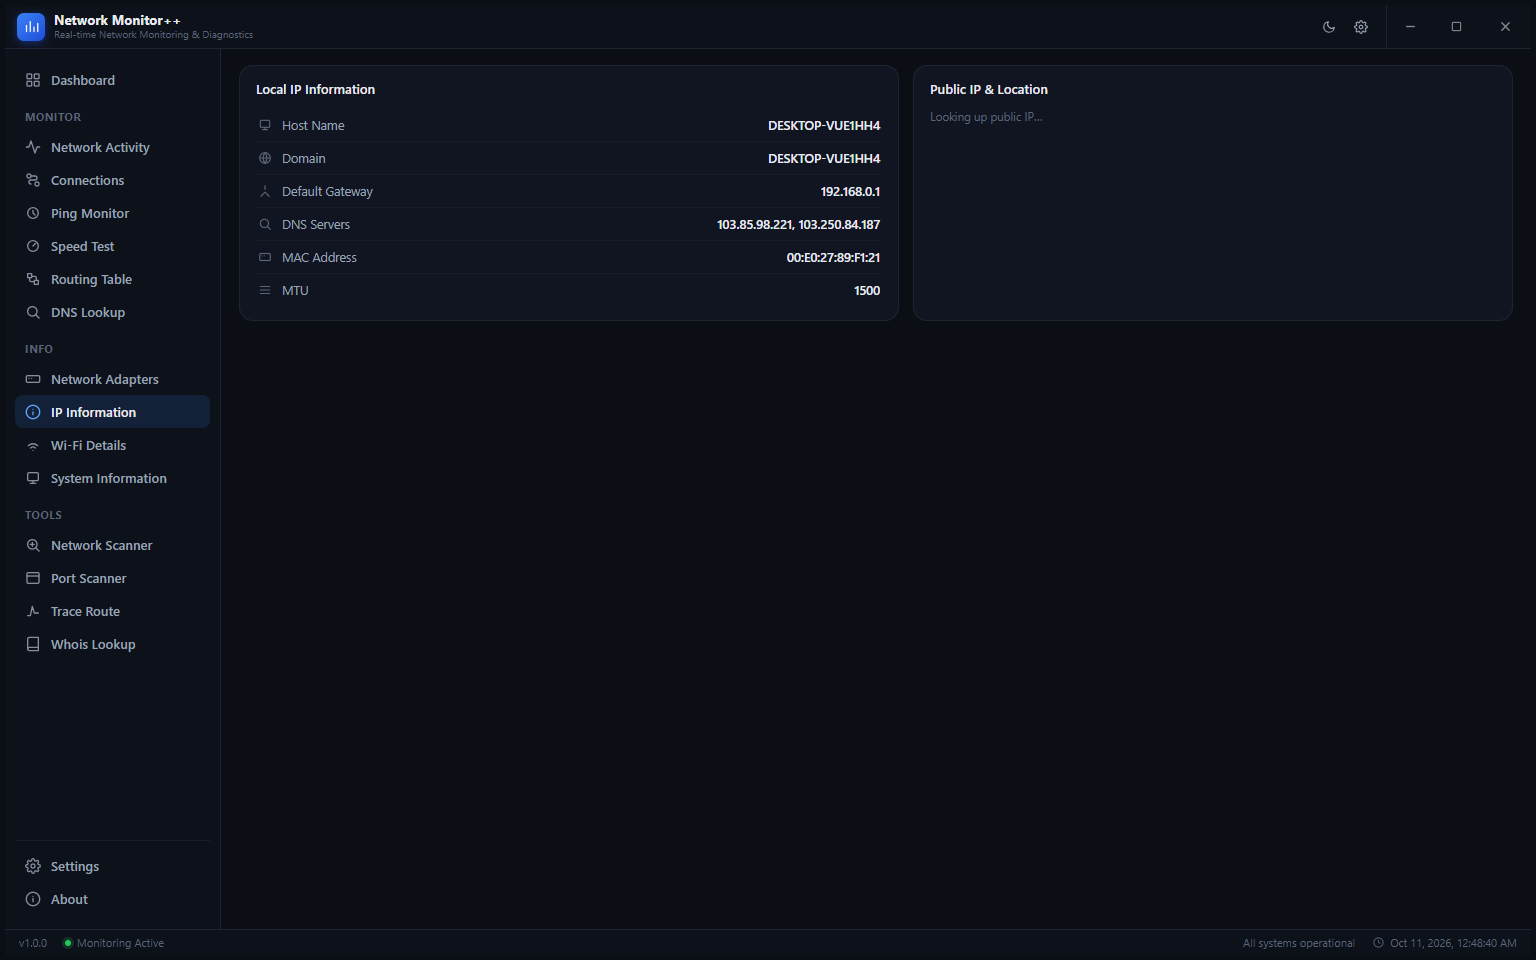
The IP Information page shows two panels side by side. Local IP Information lists your machine’s Host Name, domain, Default Gateway, DNS Servers, MAC Address and MTU. Public IP & Location on the right looks up your external IP address and geographical information — city, country, ISP. The screenshot shows the local details loaded immediately while the public IP lookup is in progress. This page is useful when you need to quickly confirm your full network identity without opening a browser.
9. Wi-Fi / Connection Details
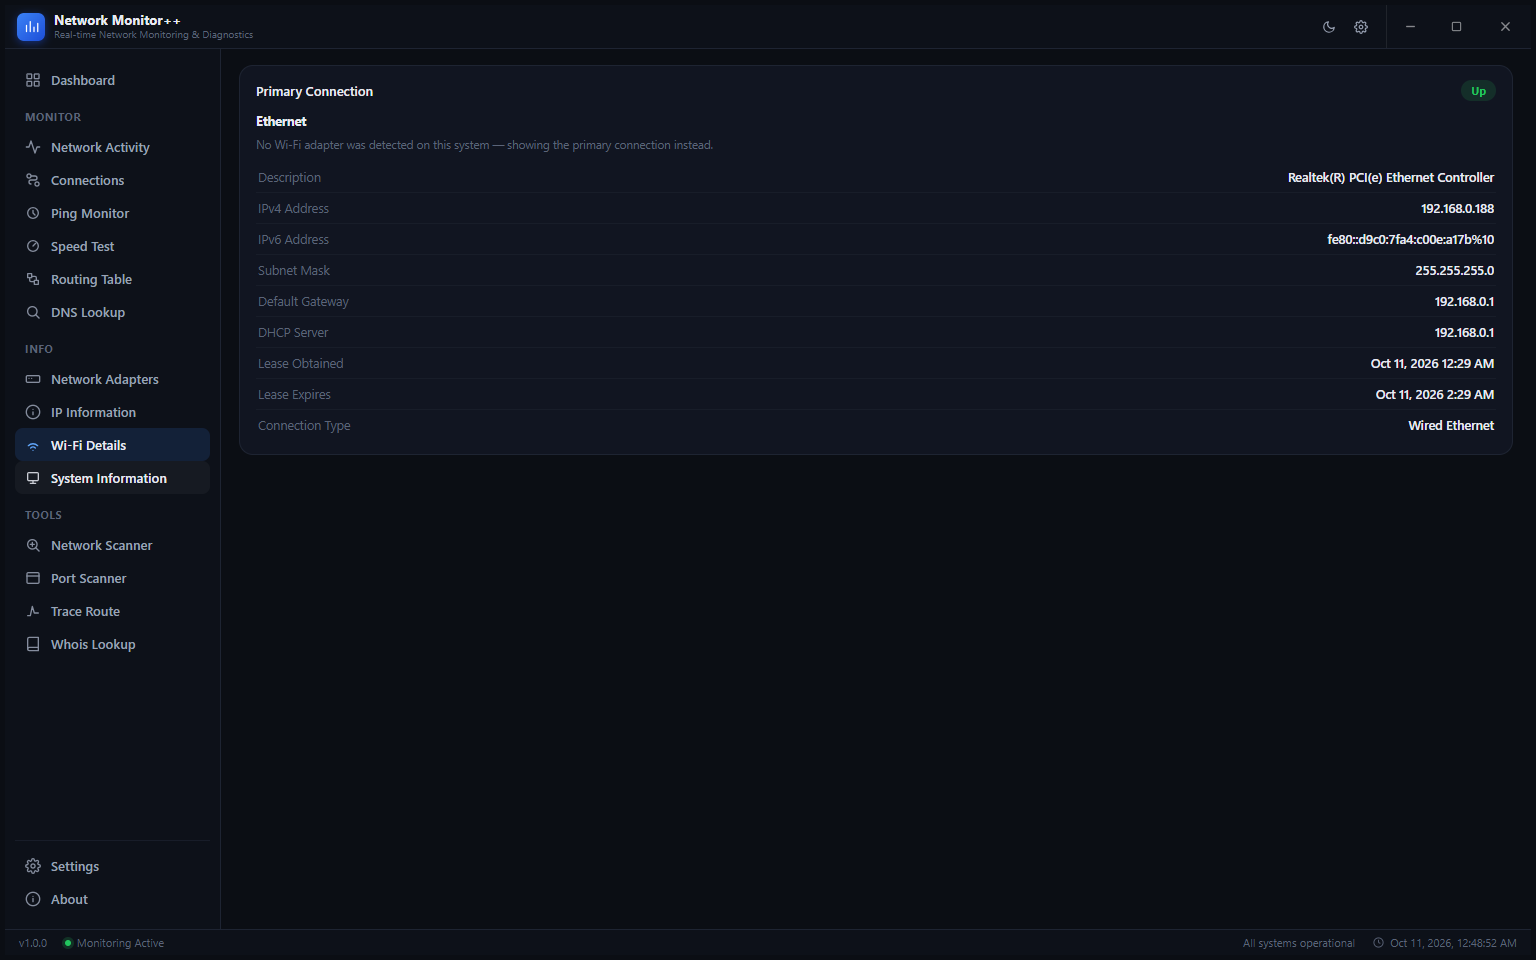
The Wi-Fi Details page shows the full specification of your primary connection. On machines without a Wi-Fi adapter it automatically falls back to the primary wired connection, clearly labelling it as Ethernet so you are never confused. The details shown include Description, IPv4 Address, IPv6 Address, Subnet Mask, Default Gateway, DHCP Server, Lease Obtained, Lease Expires and Connection Type. This is everything you would normally need to open Control Panel or ipconfig /all to find — shown in a single clean card.
10. System Information
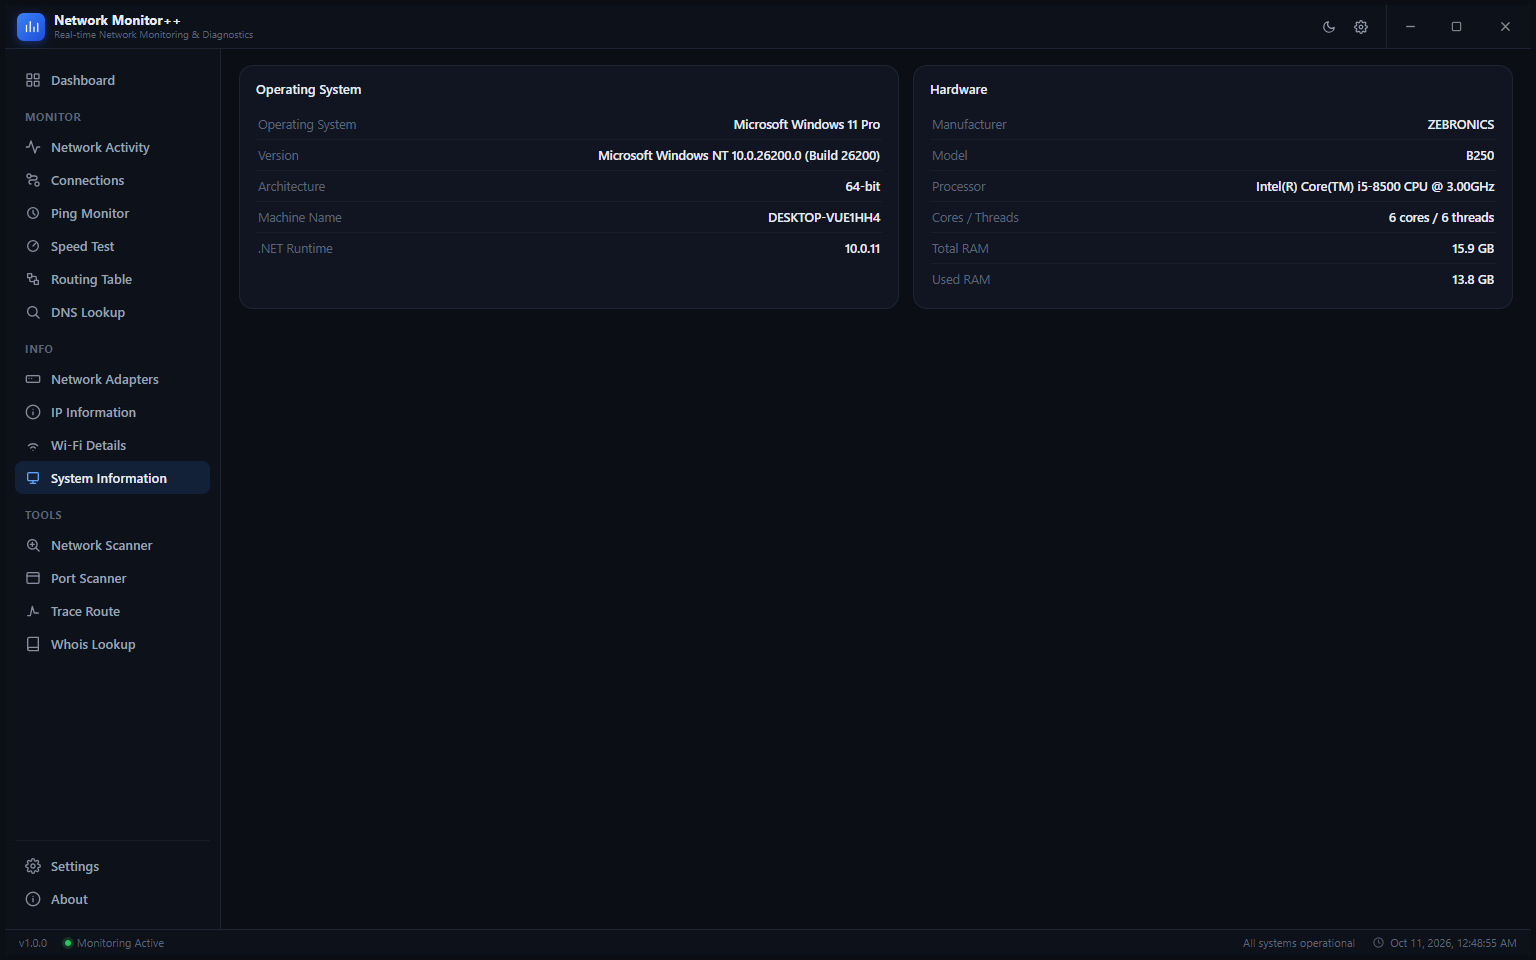
System Information shows your machine’s OS and hardware profile in two cards. The Operating System card shows the Windows edition, version string (including build number), architecture and machine name. The Hardware card shows the motherboard manufacturer and model, processor model and clock speed, core and thread count, total installed RAM and current RAM usage. This information is captured live from the Windows API — no third-party tool required. Knowing the machine’s specs and OS build alongside network data is useful when troubleshooting compatibility issues or documenting a client’s environment.
11. Network Scanner — Find Every Device on Your LAN
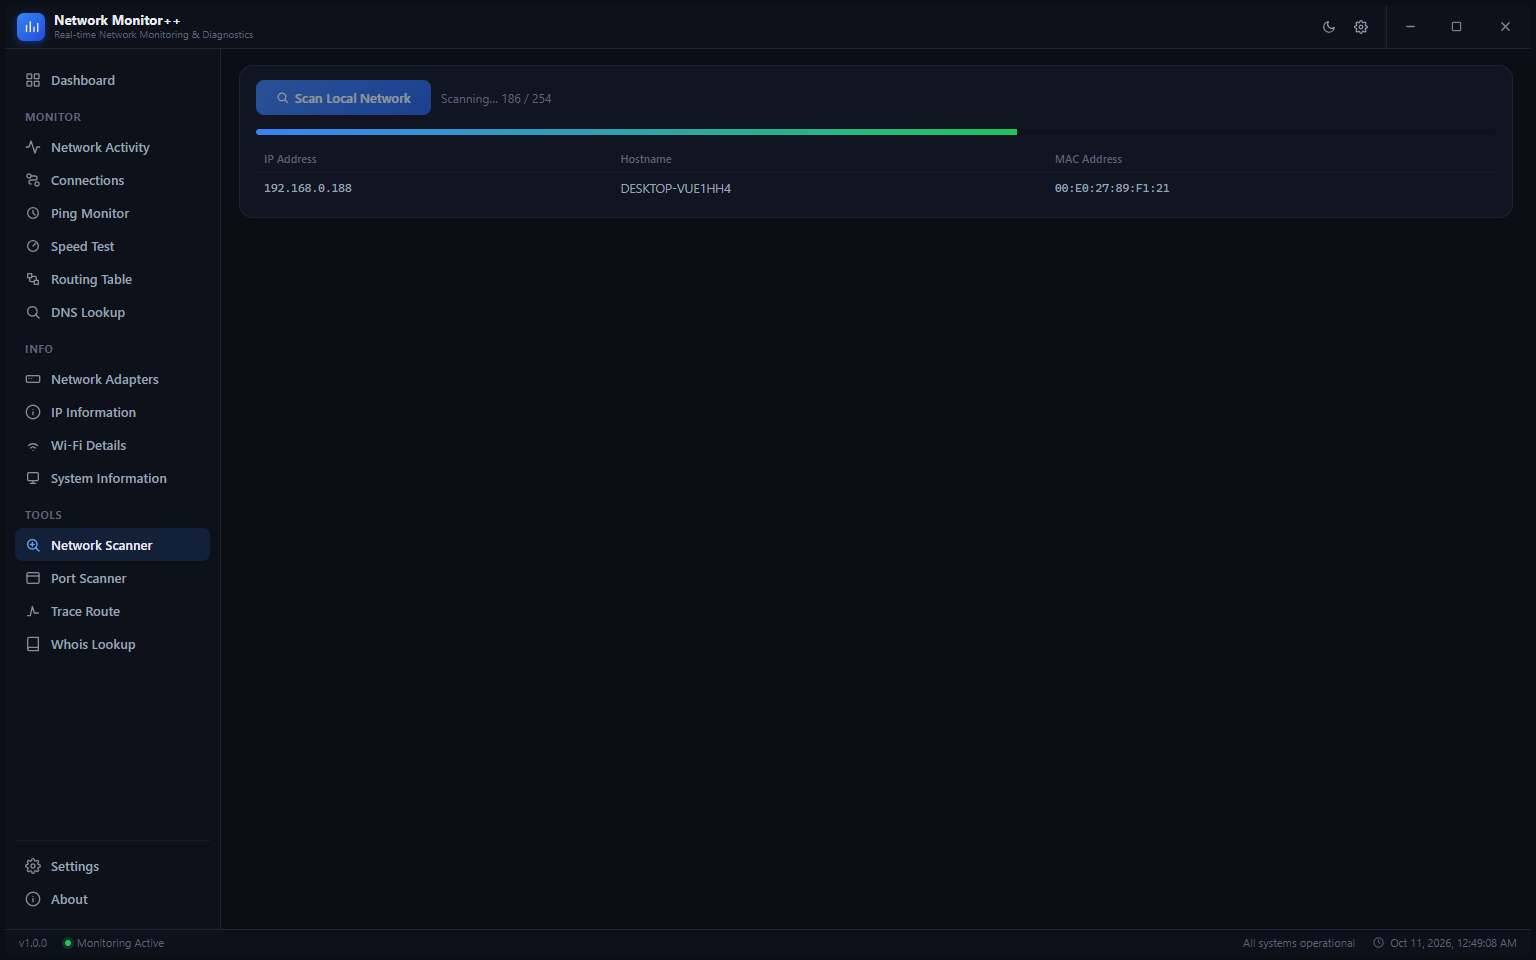
The Network Scanner sweeps every IP address on your local subnet — all 254 possible hosts — and reports back every device that responds. A progress bar and counter show how far through the scan you are in real time. Devices that respond appear in the table as they are discovered, showing their IP Address, Hostname and MAC Address. In this screenshot the scan is 186 addresses through and has already found the local machine at 192.168.0.188.
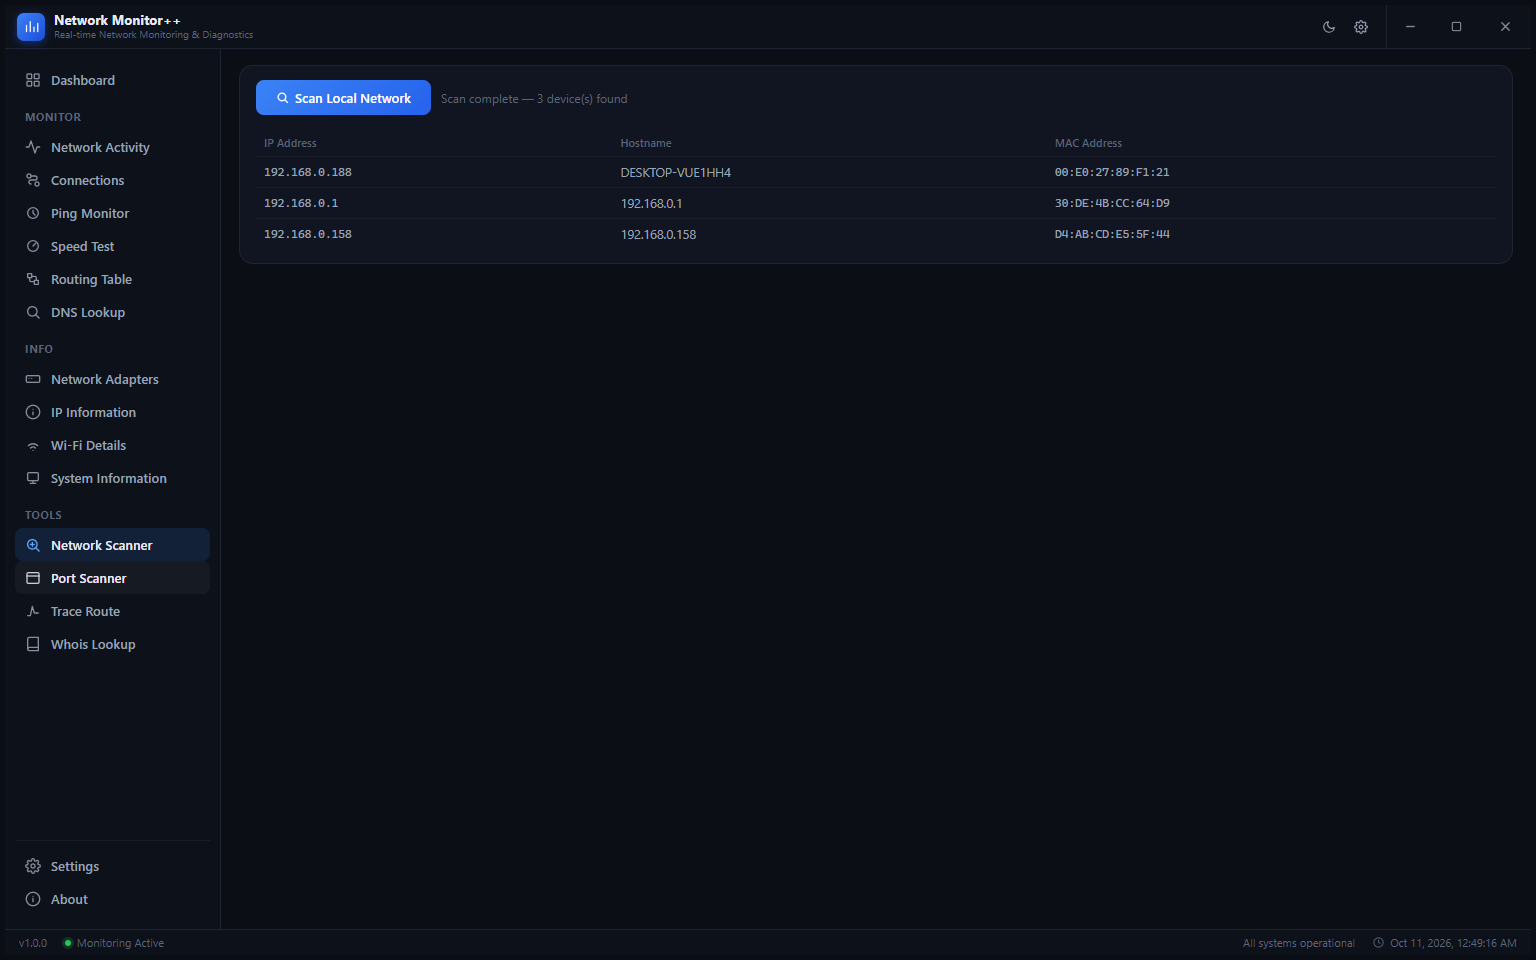
When the scan finishes, the header shows the total count — here, 3 devices found. The table shows the desktop at 192.168.0.188, the router at 192.168.0.1 and a third device at 192.168.0.158. Each row includes the MAC address, which lets you identify the device’s manufacturer from the OUI prefix even when the hostname is blank. Network Scanner is the fastest way to audit who is on your Wi-Fi or wired LAN without installing a heavyweight network tool.
12. Port Scanner
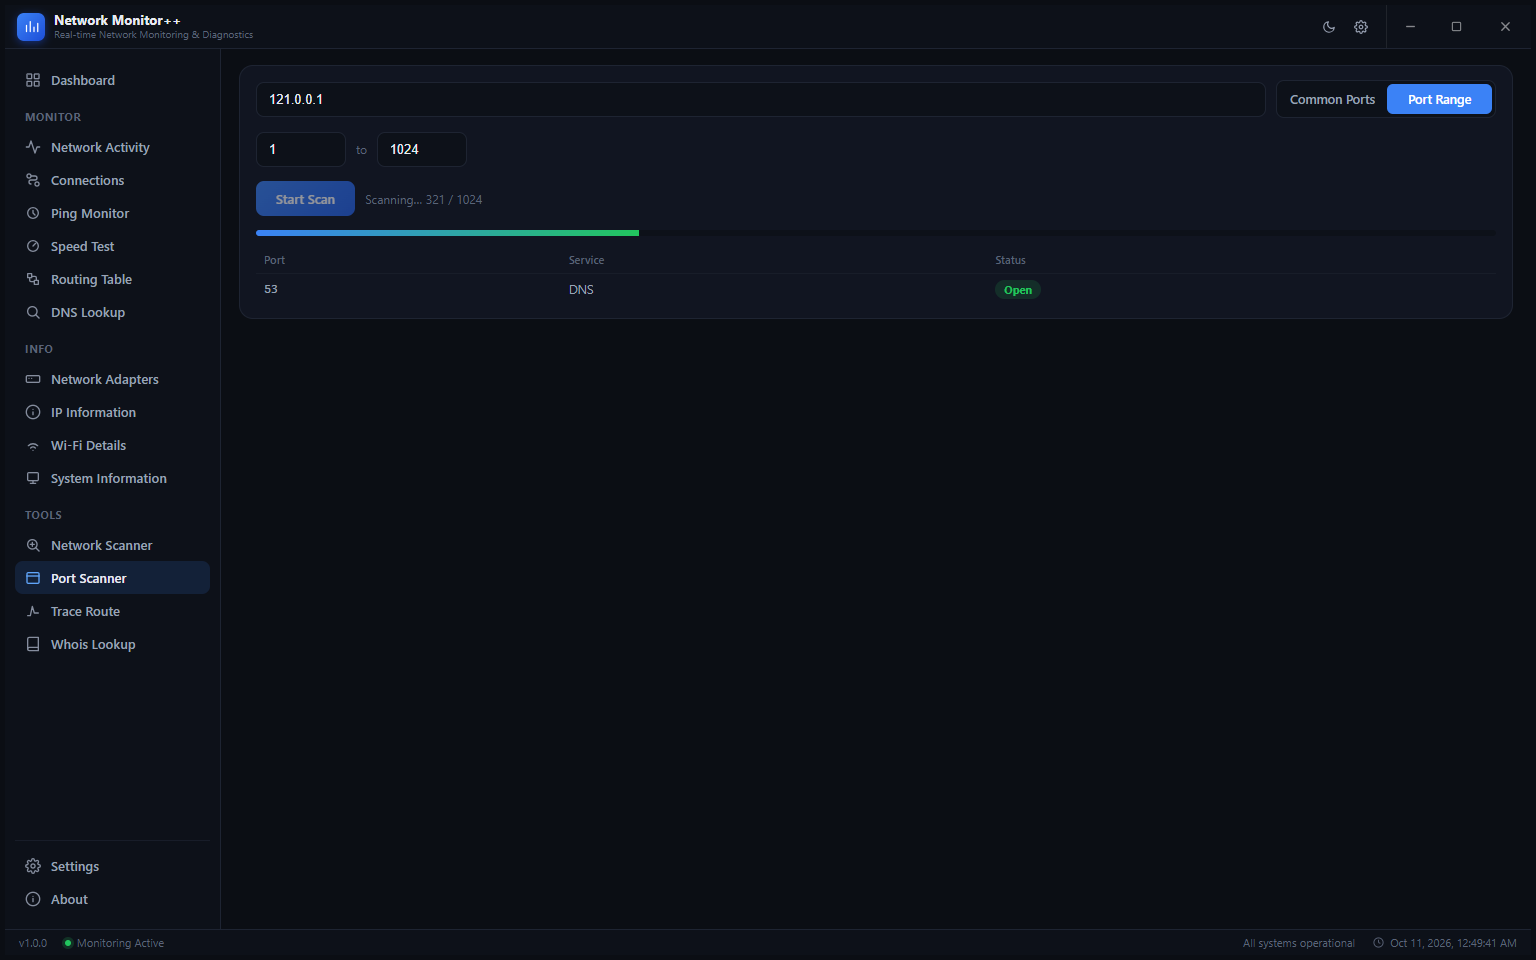
The Port Scanner checks which TCP ports are open on any IP address. Enter a target IP, choose Common Ports or a custom Port Range (with start and end fields), and click Start Scan. A progress bar tracks how far through the range the scan has reached. Open ports appear in the table as they are discovered, showing the port number, the recognised service name (DNS for port 53, HTTP for 80, HTTPS for 443, and so on) and a green Open badge. Port Scanner is useful for verifying that a server’s firewall is configured correctly, confirming that a service is listening before you try to connect, or auditing what is exposed on a device before putting it into production.
13. Trace Route
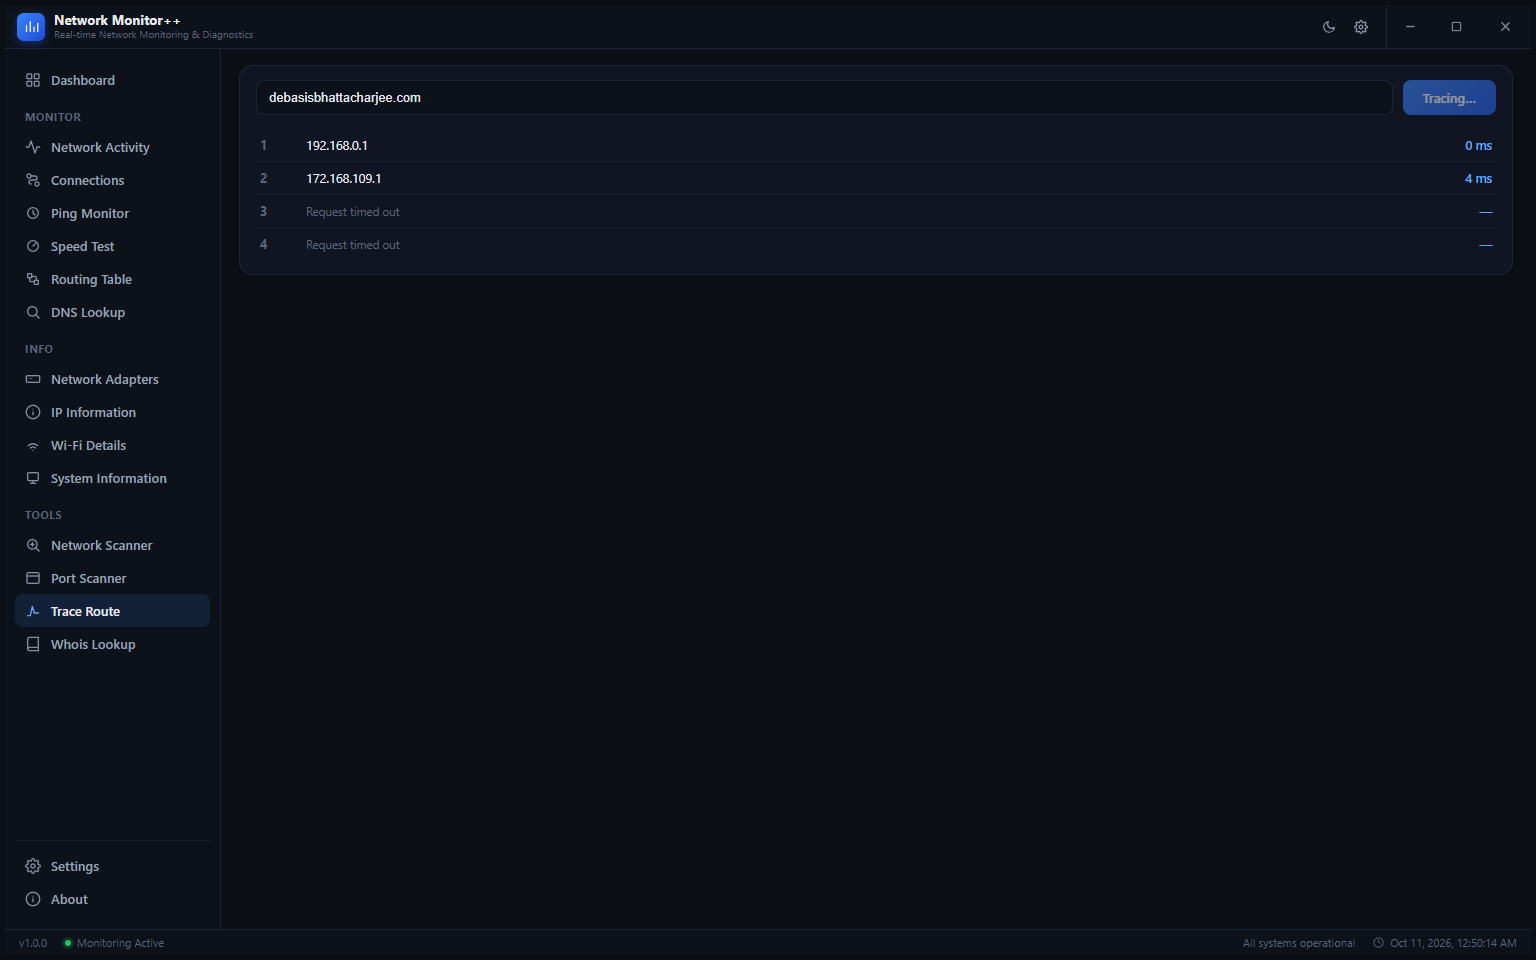
Trace Route maps every network hop between your machine and a destination host, showing you exactly where packets travel and how long each hop takes. Type a domain or IP in the field and the trace begins immediately — hops appear as they resolve, numbered from 1. In this trace to debasisbhattacharjee.com, hop 1 is the local router at 192.168.0.1 (0 ms), hop 2 is the ISP’s first upstream router at 172.168.109.1 (4 ms), and hops 3 and 4 time out — common behaviour for routers configured not to respond to ICMP. Trace Route is the standard tool for identifying where a slow or dropped connection actually breaks, which lets you tell whether the problem is your ISP, a transit network or the destination server.
14. WHOIS Lookup
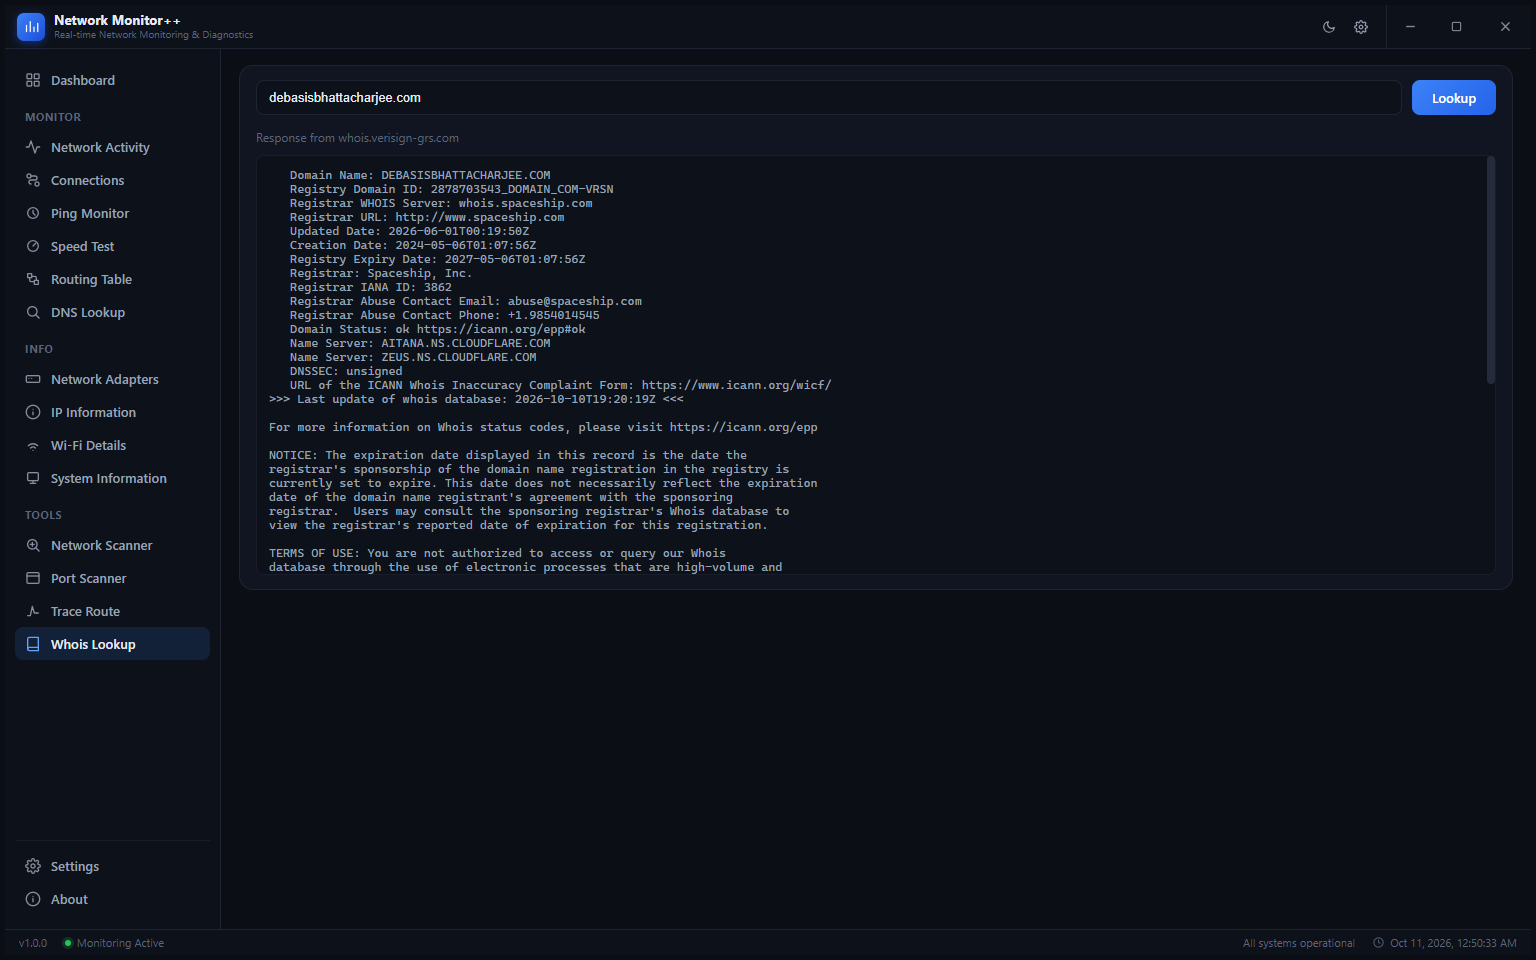
The WHOIS Lookup tool queries the public WHOIS database for any domain and returns the full raw response in a scrollable panel. For debasisbhattacharjee.com the response shows the registrar (Spaceship, Inc.), creation date (2024-05-06), expiry date (2027-05-06), nameservers (Cloudflare), domain status and the WHOIS server source (whois.verisign-grs.com). WHOIS Lookup is useful for verifying domain ownership, checking when a competitor’s domain expires, investigating the source of spam or confirming your own registration details — all without leaving the app or copying and pasting into a browser.
15. Settings
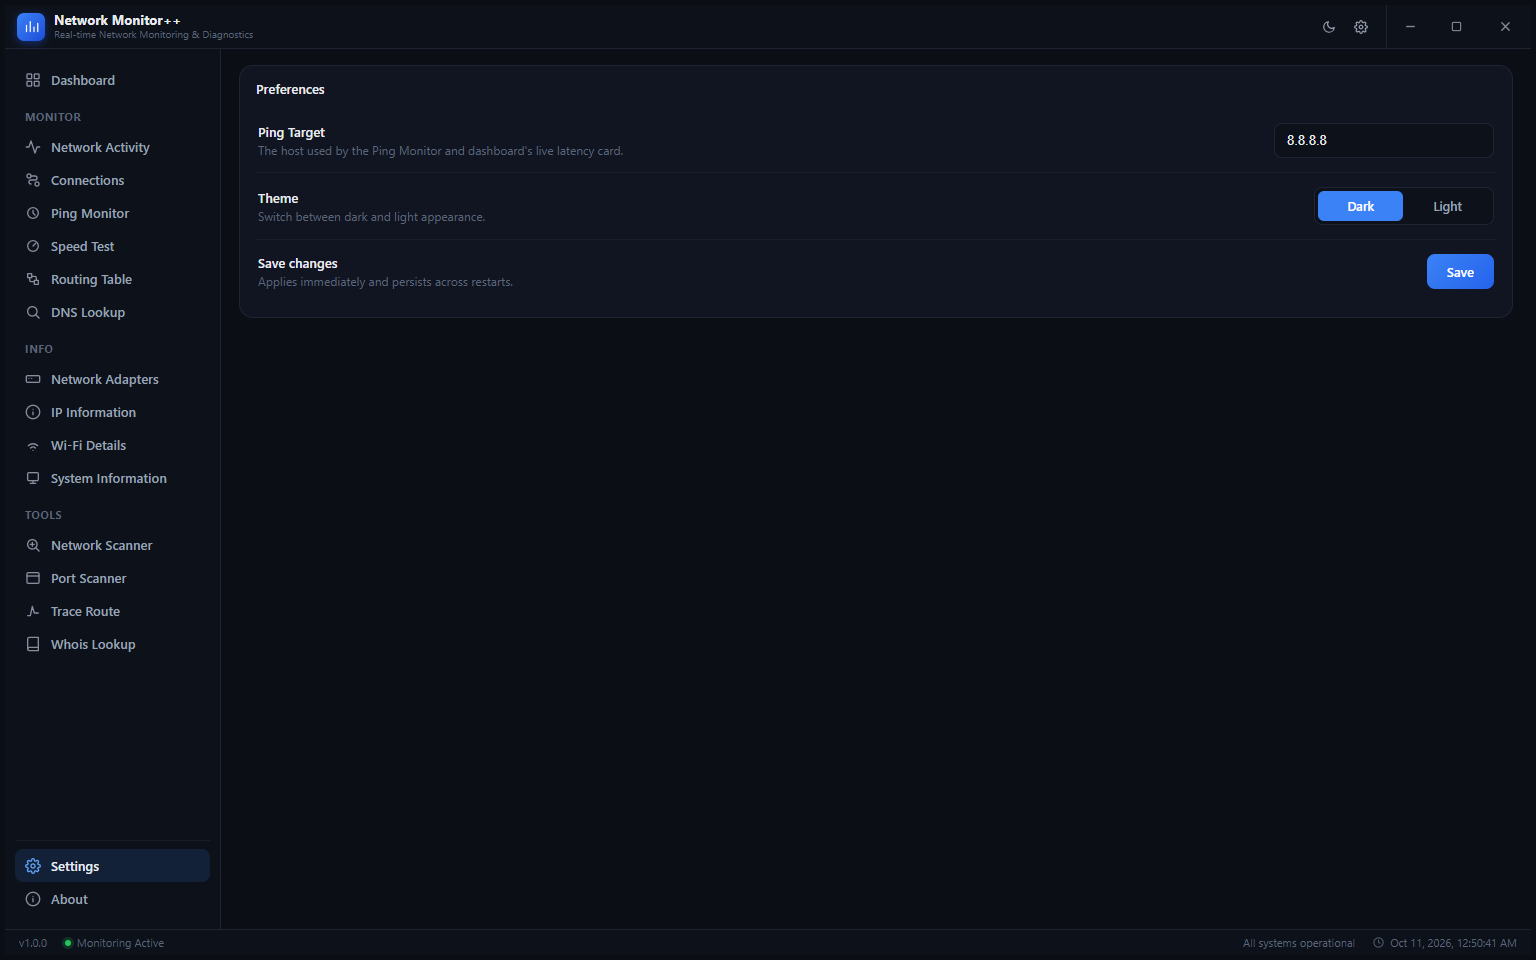
The Settings page keeps things simple. Ping Target lets you change the default host used by both the Ping Monitor and the dashboard’s live latency card — set it to your router (usually 192.168.0.1) for a true local latency reading, or to a specific server if you are monitoring a remote connection. The Theme toggle switches between Dark and Light appearance instantly. Settings are saved with the Save button and persist across restarts.
16. About
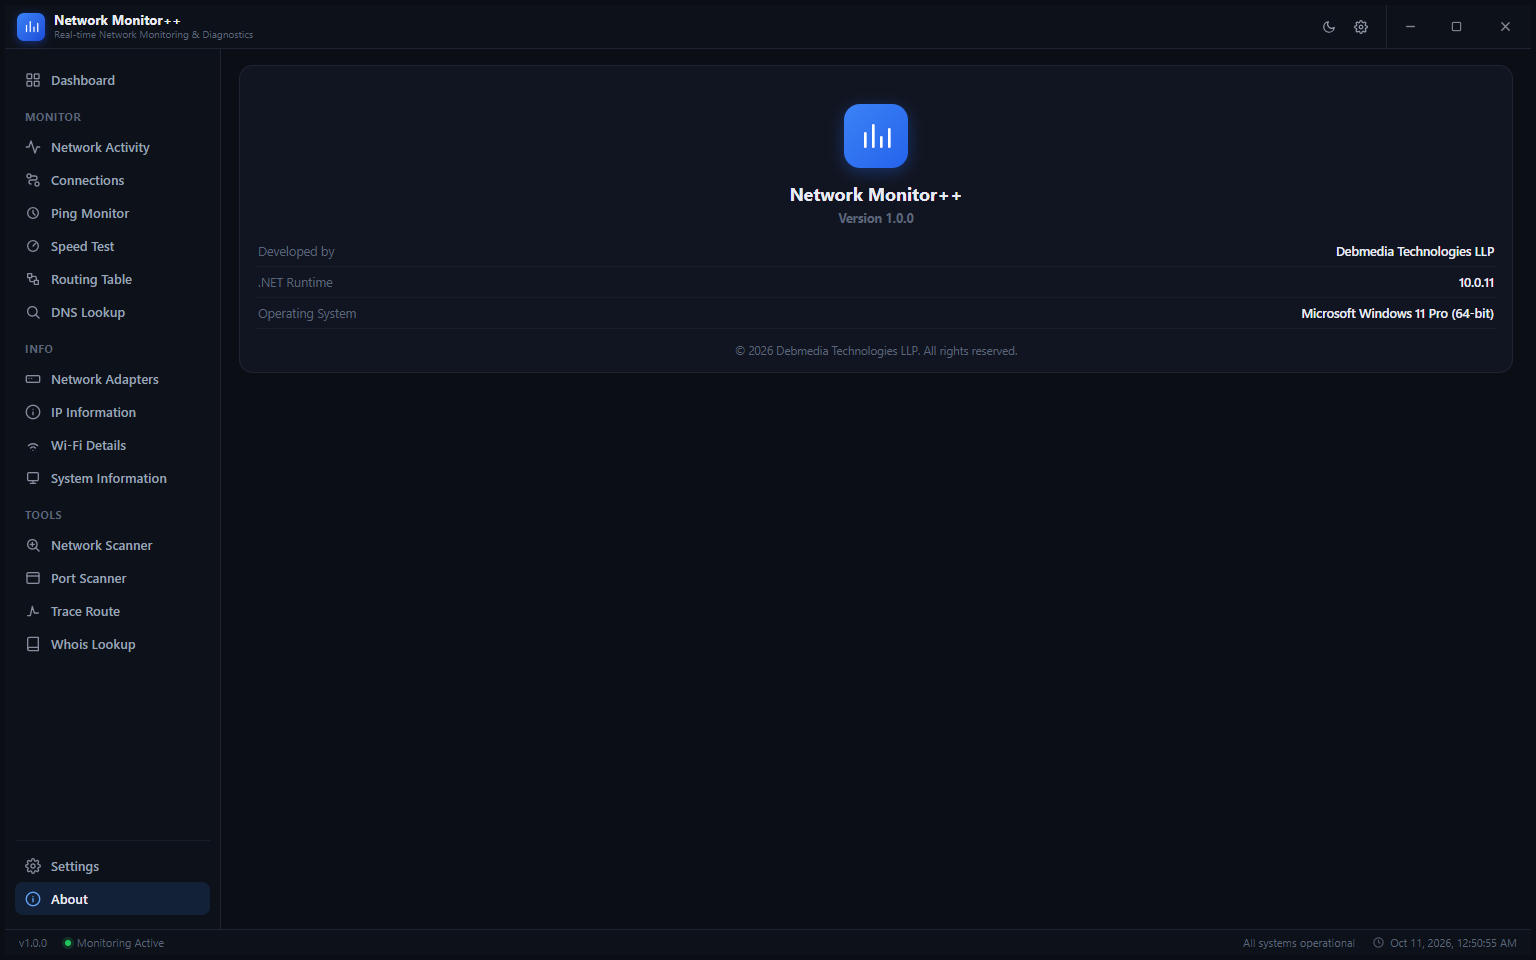
The About page shows the application name, version (1.0.0), developer (Debmedia Technologies LLP), the .NET runtime version in use (10.0.11) and the host operating system detected at launch. This information is useful when reporting a support issue or verifying that you are running the latest version.
Network Monitor++ also supports a clean light mode. Switching to Light theme in Settings immediately transforms the entire interface — the dark background becomes a crisp white canvas, panels shift to soft grey cards and the charts retain their colour-coded lines against a brighter background. Every feature works identically in both themes.
Who Is Network Monitor++ For?
- Home users — Find out if your internet is actually slow or if one app is hogging the bandwidth. Identify every device on your home network and check what ports your router has open.
- IT professionals and sysadmins — Monitor connections, audit open ports, trace routes to diagnose network path issues and document client machine configurations without installing multiple separate tools.
- Developers — Watch which connections your own application is making, verify DNS propagation after a deployment and run latency tests against your API servers from your dev machine.
- Network security enthusiasts — Monitor which processes are talking to which remote addresses in real time and scan your LAN to detect unexpected devices.
- Remote workers — Keep an eye on VPN latency, detect bandwidth-heavy background processes and verify your connection is stable before a video call.
System Requirements
- Operating System: Windows 10 (64-bit) or Windows 11
- Processor: Any modern x64 processor
- RAM: 4 GB minimum
- Storage: 100 MB for the application
- Runtime: .NET Desktop Runtime 10.0 (included if not already present)
- Internet: Required only for Speed Test, DNS Lookup and WHOIS features; all local monitoring works fully offline
Frequently Asked Questions
Does it require installation or admin rights?
The app comes with an installer. Some features — such as reading all active connections including those owned by system processes — require running with elevated privileges. The installer handles this automatically.
How often does the data refresh?
The dashboard, Network Activity chart, Connections table and Ping Monitor all refresh in real time — typically every one to two seconds. The Network Scanner and Port Scanner update as each result comes in during a scan.
Can I monitor multiple network adapters?
Yes. The Network Activity page and Adapter Details panel on the dashboard both list all detected adapters. The throughput chart shows traffic across all adapters combined by default.
Does it send my network data anywhere?
No. All monitoring data stays on your machine. The only outbound connections Network Monitor++ makes are the ones you explicitly trigger: Speed Test, DNS Lookup, WHOIS Lookup and Ping Monitor use external servers, and Public IP lookup contacts a geolocation API. Everything else is entirely local.
Your Network, Fully Visible
Network Monitor++ replaces a handful of separate command-line tools and browser-based lookups with a single, always-on desktop application. From the moment it opens, your network is live on screen — bandwidth, connections, latency, devices and more — all in one dark or light themed interface built for Windows.
Whether you are diagnosing a problem, auditing your setup or simply staying informed about what your machine is doing on the network, Network Monitor++ gives you the visibility you need. Download it now and see your network in real time.
Download Network Monitor++
Monitor network usage, connected devices and internet speed in real time