HW Monitor ++
Real-time hardware monitoring — temperatures, voltages, fan speeds and usage
HW Monitor++ displays live sensor data from every hardware component in your PC — CPU and GPU temperatures, individual core usage, RAM consumption, fan RPM readings, system voltages and storage temperatures — all updated in real time. The interface is organized into clear panels: an Overview dashboard shows your system at a glance, while dedicated sections for CPU, GPU, Memory, Storage, Motherboard and Fans give you deep per-component detail. Historical charts let you track how your hardware behaves under load over time. HW Monitor++ reads data directly from hardware sensors using low-level libraries — no guessing, no estimates. It is the tool to have open during gaming sessions, benchmarks, stress tests or whenever you suspect your PC is running hot.
See HW Monitor++ in Action
A clean, modern interface designed for real-world use.
Debmediahardwaremonitor screen 01 screenshot
What Is Debmedia Hardware Monitor?
Debmedia Hardware Monitor is a Windows system monitoring tool that reads real-time sensor data from every hardware component in your PC and presents it in a clean, light-themed sidebar interface. Powered by LibreHardwareMonitor.dll for deep sensor access, it tracks CPU core temperatures, GPU metrics, memory usage, storage health, voltages, power draw, battery status and network activity — displaying current, minimum and maximum values in a searchable table alongside live CPU temperature and utilization graphs. It is a comprehensive, free alternative to running multiple monitoring utilities at once.
Screen-by-Screen Feature Walkthrough
System Overview — The Complete Health Dashboard
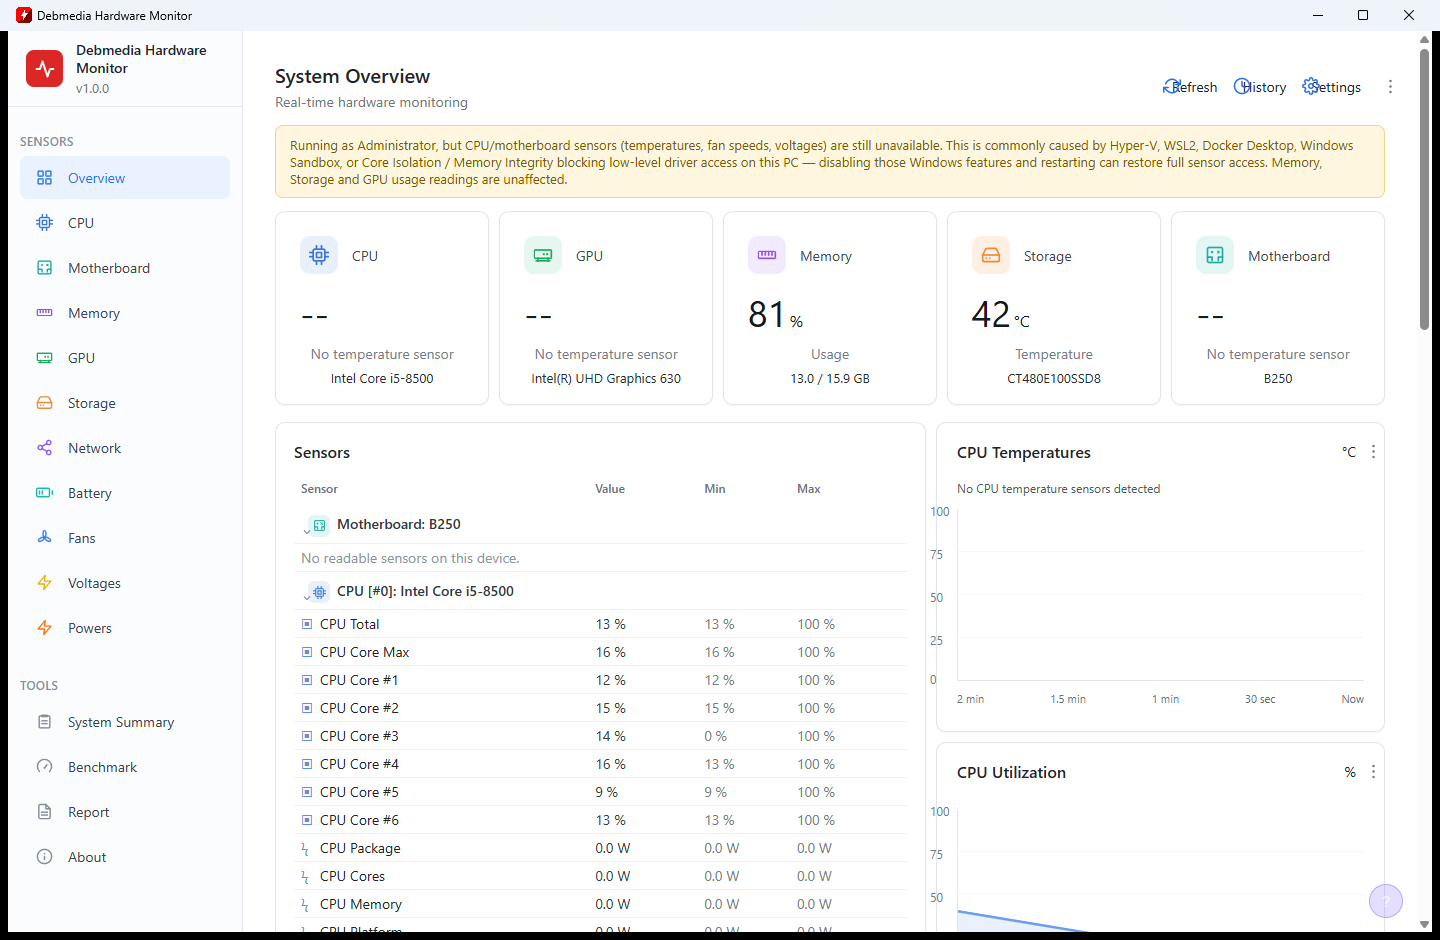
The System Overview is the first screen you see on launch — five summary cards across the top show your CPU model, current memory usage (81%), GPU, storage temperature (42°C) and motherboard identifier at a glance. Below the cards, a sensor data table begins with the Motherboard BIOS readings and immediately flows into CPU Core temperatures for every core (Core #0 through Core #5, plus CPU Package, Platform, Cores and CCD1 values). On the right, a live CPU Temperatures graph and a CPU Utilization graph update in real time so you can monitor load and thermal behaviour simultaneously without switching views.
CPU Monitoring — Per-Core Temperature and Load
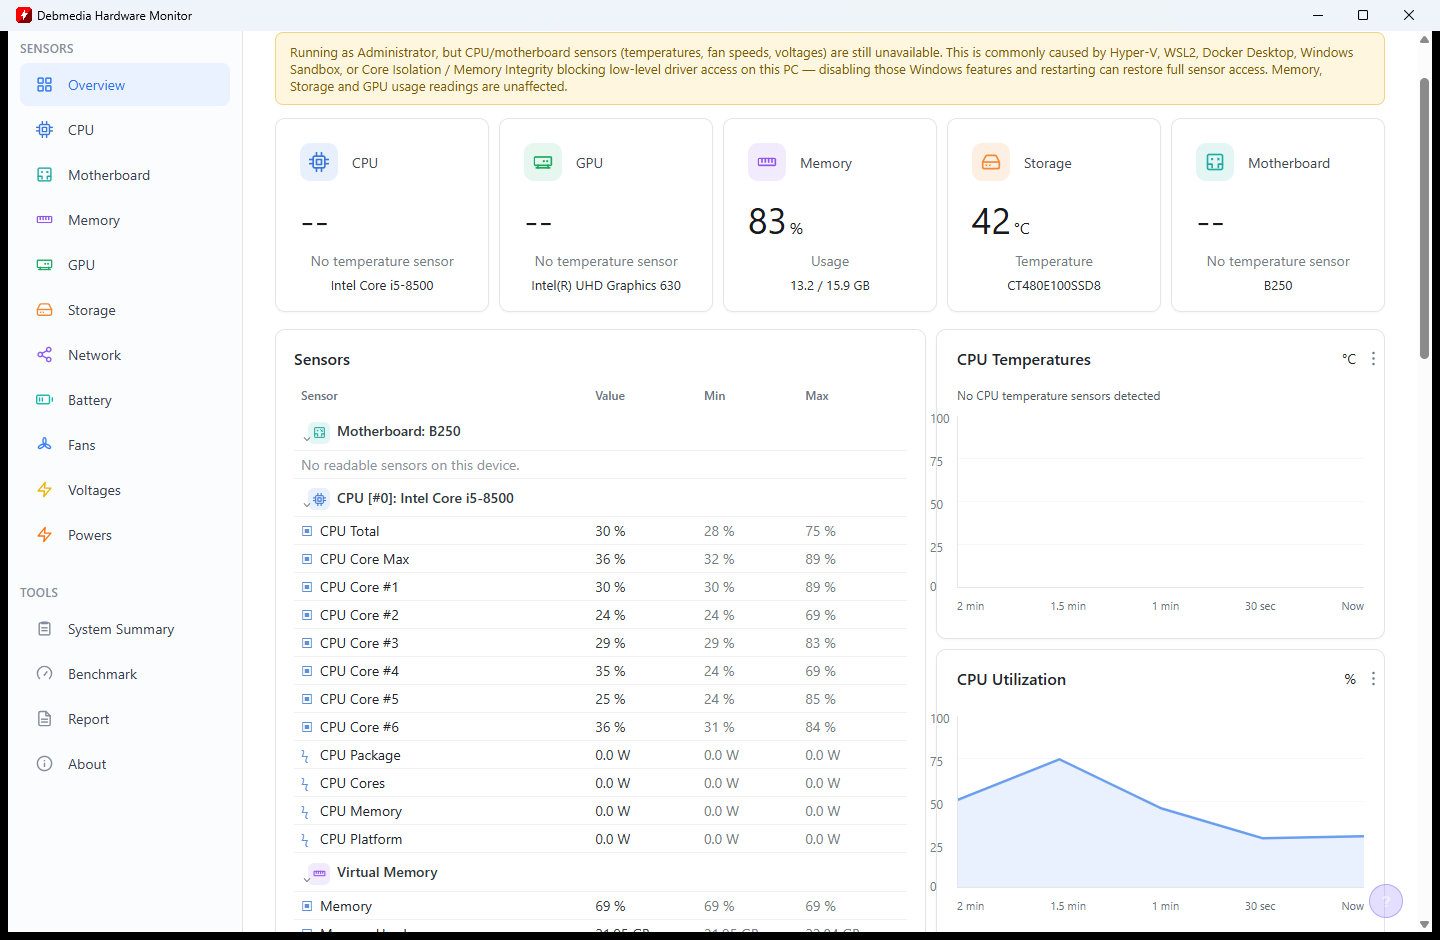
Selecting CPU in the left sidebar filters the sensor table to show only CPU-related readings. Each row shows the sensor name, the current value, the session minimum and the session maximum — so you can see at a glance that Core #2 reached 88°C at its hottest while Core #0 is currently sitting at 32°C. This per-core visibility is essential for diagnosing thermal throttling, spotting failing thermal paste, or confirming that your cooling is performing uniformly across all cores.
CPU Load and Thermal Analysis
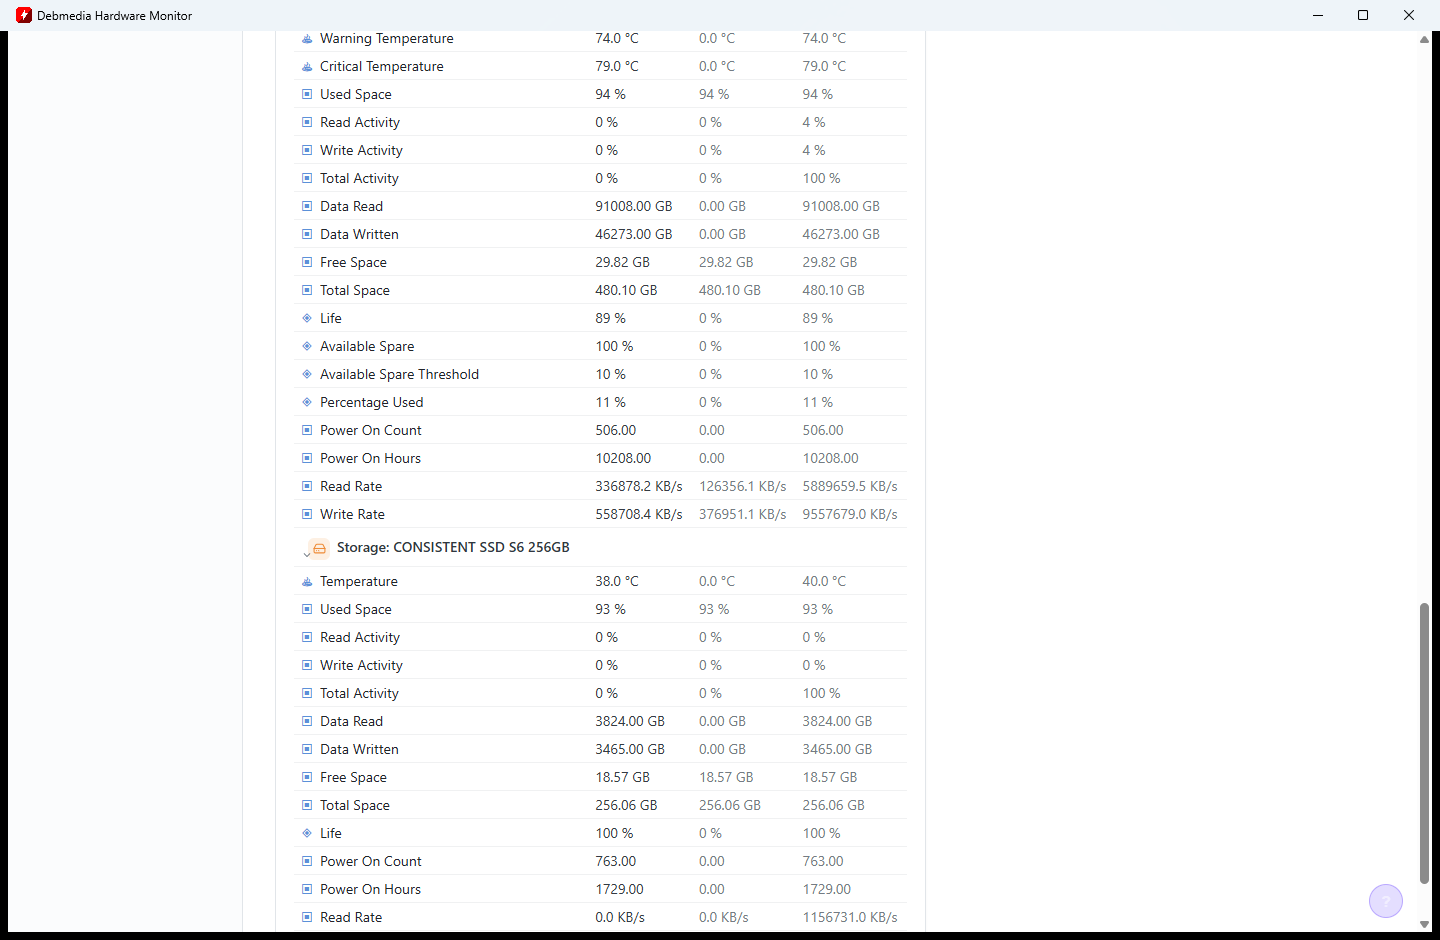
The CPU section updates continuously as the processor’s load changes. The min/max columns track the extremes seen since the monitoring session started, giving you a running record of your CPU’s thermal range without needing to watch the screen continuously. If you run a stress test, compile a large project or play a demanding game, the max column captures the peak temperature and load values automatically — useful for verifying that a new cooler or fresh thermal paste is actually improving sustained performance.
Storage Health — NVMe SSD Sensor Data
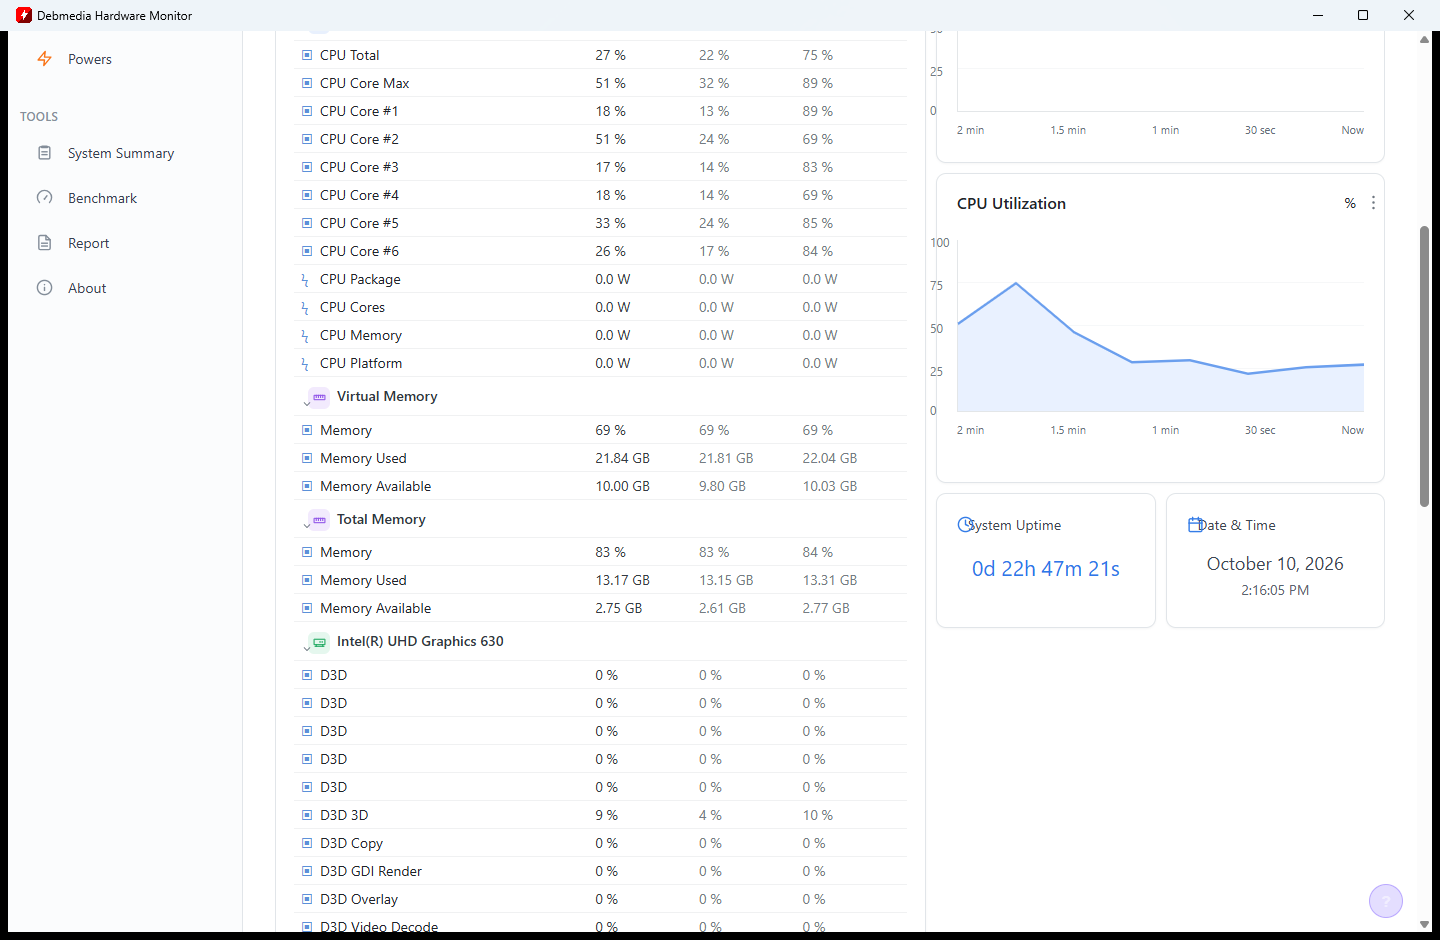
The System Summary view includes a comprehensive section for each storage device. For an NVMe SSD, it shows Composite Temperature, Warning Temperature and Critical Temperature thresholds, Read Activity, Write Activity and Total Activity percentages, the drive’s current capacity usage (96 GB of 256 GB used), Life percentage (7% used), Available Spare capacity (100%), and low-level sync counters. In the bottom-right corner, the current system uptime (2 days 22 hours 48 minutes) and the current date and time are displayed — a quick reference that requires no other tool to check.
CPU Sensor Detail — Intel Core Data
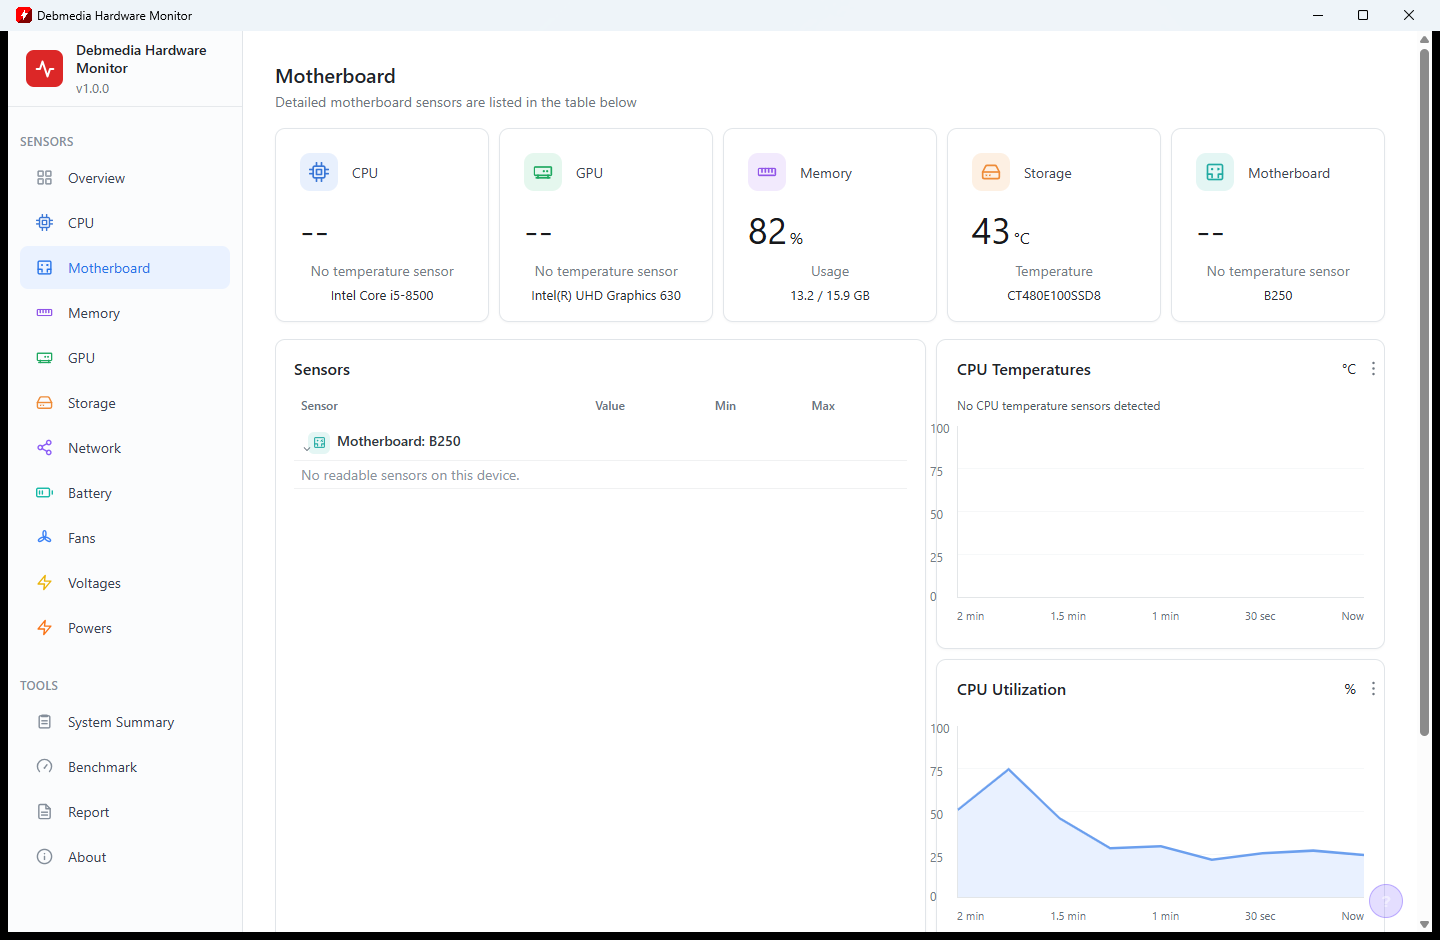
The CPU sensor data refreshes automatically at regular intervals. As your workload changes — a browser tab opens, a background task completes, a video starts playing — the sensor readings update to reflect the new thermal and load state of the processor. The graph panel on the right captures this change over time, so even a brief thermal spike that might be missed in a static table is visible in the historical graph. This combination of table precision and graph history makes sustained temperature analysis straightforward.
Per-Core Temperature Tracking
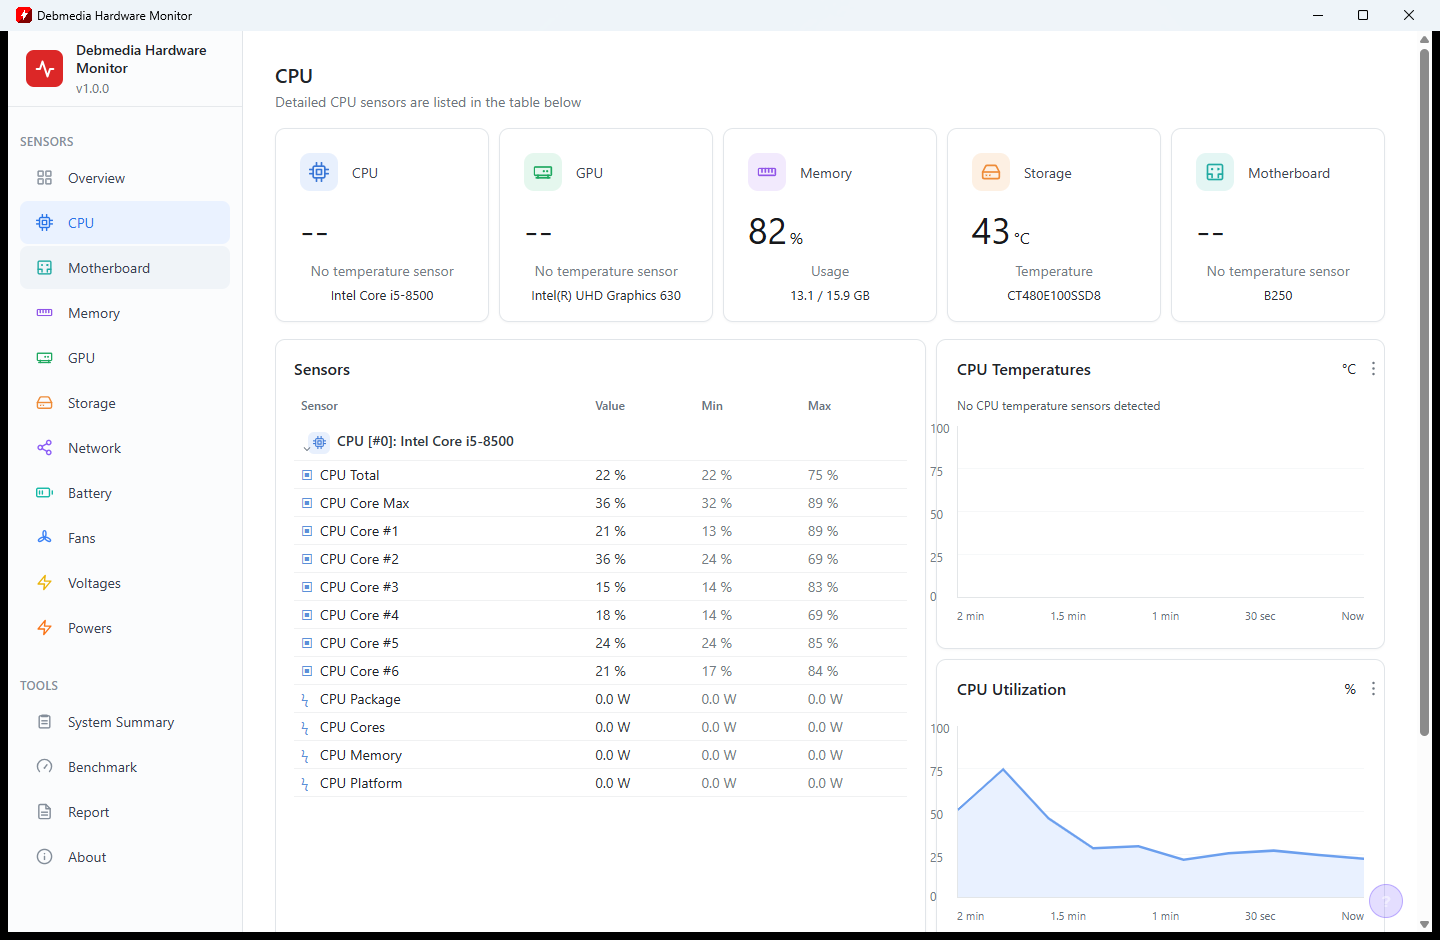
For processors with multiple cores, every core gets its own row in the sensor table. This Intel Core i5 8500 view shows CPU Total load at 27%, CPU Core Max at the highest value seen across all cores, then individual readings for Core #0 through Core #5 — each with current, minimum and maximum temperature columns. Spotting which core runs consistently hotter than the others is useful for diagnosing uneven heat distribution, which can indicate a warped heatsink contact surface or an improperly applied thermal pad.
Motherboard Sensor Readings
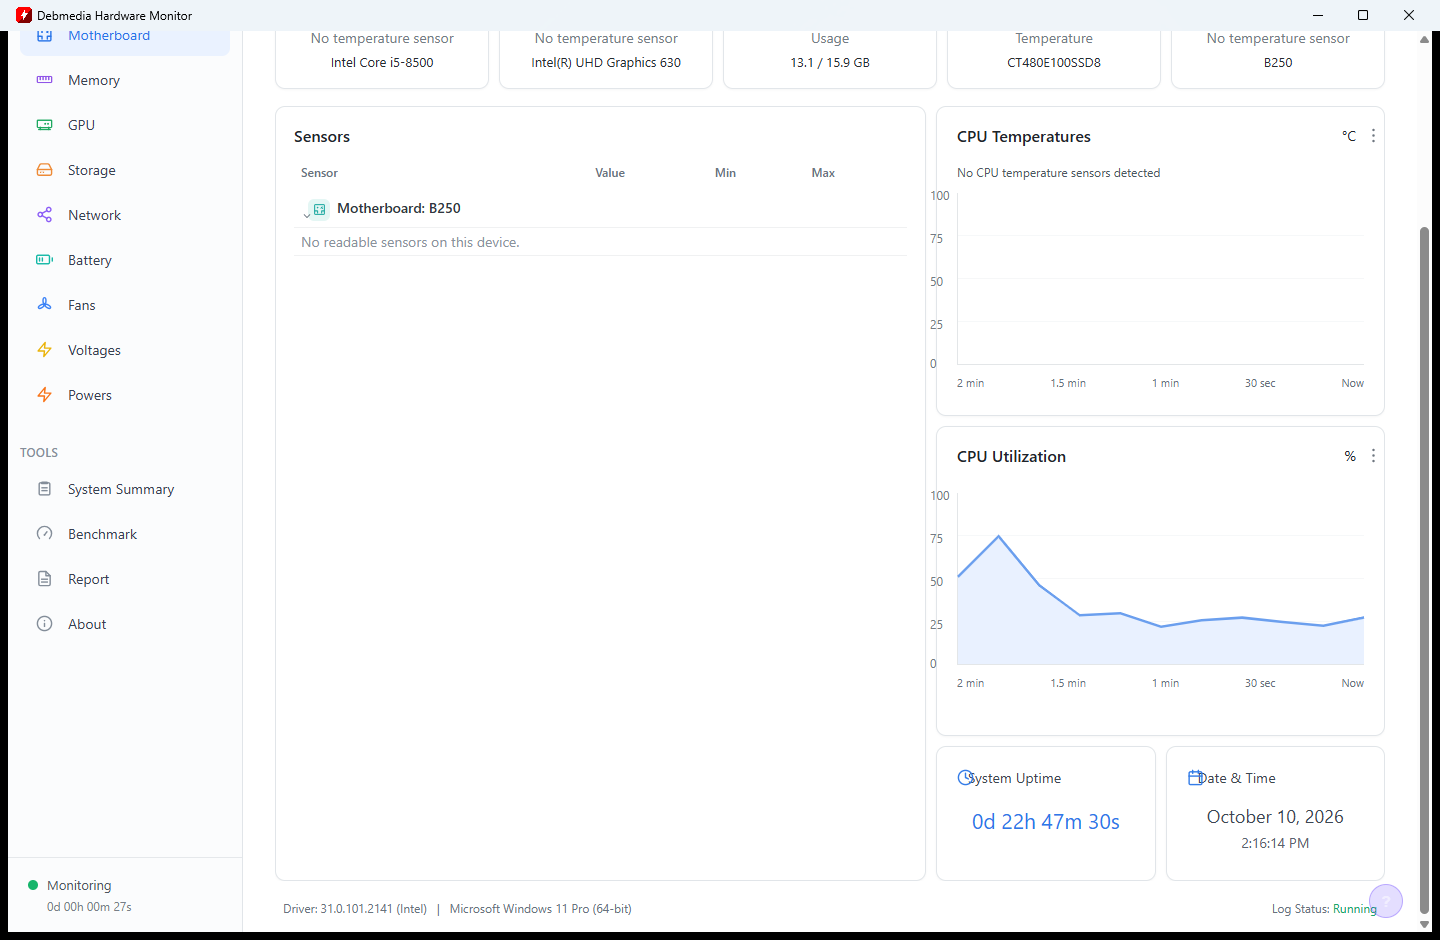
The Motherboard section reads BIOS-level sensor data that the board exposes through the hardware monitoring controller — typically voltages, fan speeds and chipset temperature. These sensors complement the CPU-level data by showing the voltage rails that power the processor, confirming that the 12V, 5V and 3.3V rails are within specification. Voltage deviations outside normal tolerances can cause instability, random crashes and premature component failure, and monitoring them proactively catches those issues before they become critical.
Memory Usage — Virtual and Physical RAM
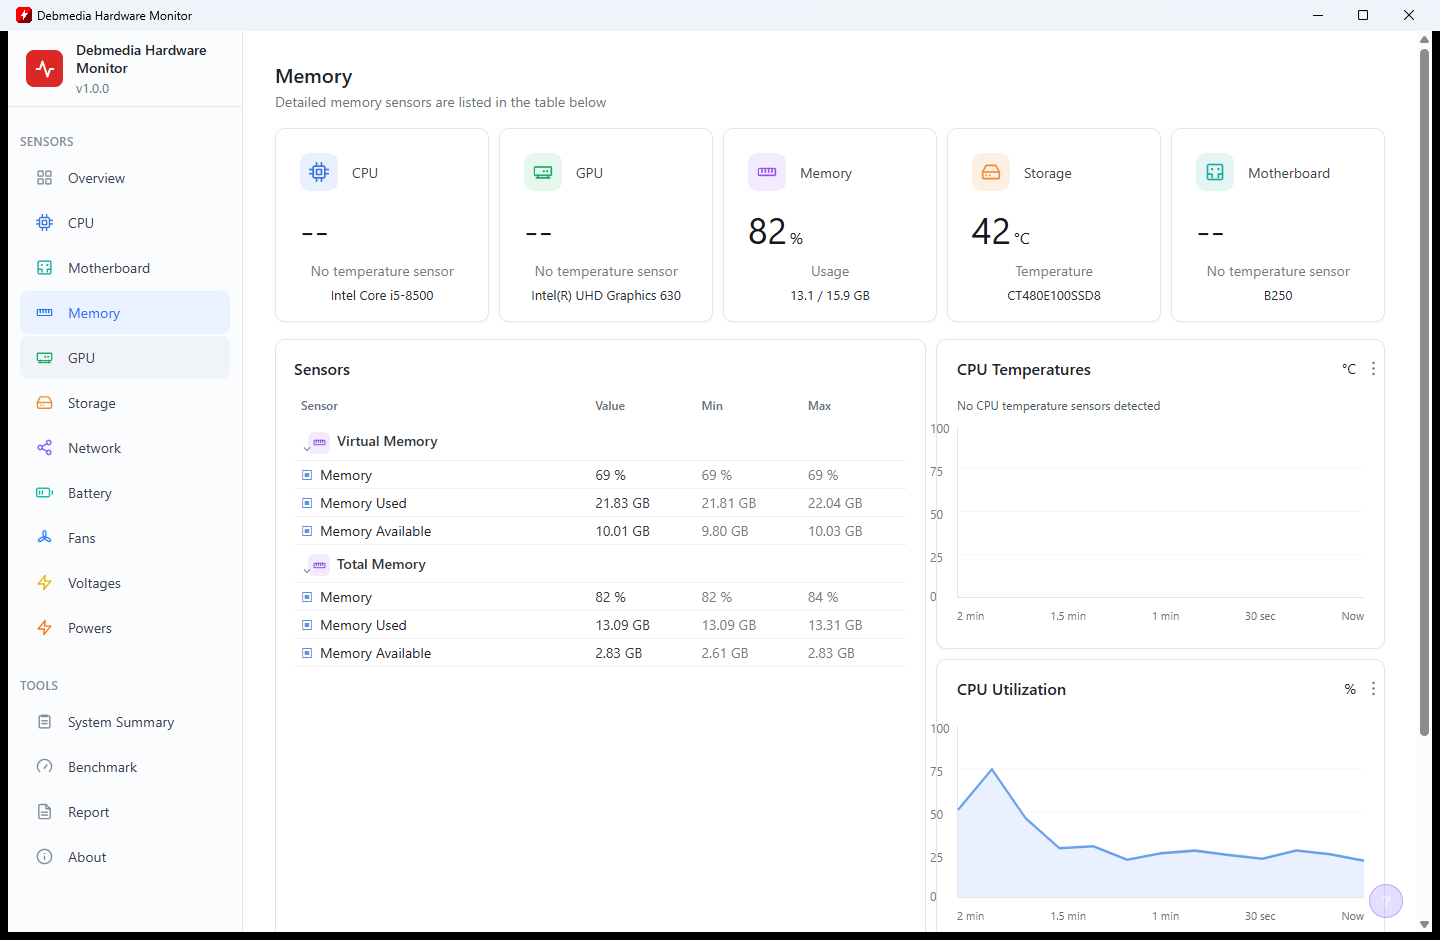
The Memory section shows both Virtual Memory and Physical RAM as separate sensor groups. Virtual memory currently shows 68% usage with 11.52 GB in use out of a 15 GB total (reflecting the combined RAM + page file capacity). Physical RAM is at 82% with 13.03 GB in use and only 2.65 GB remaining free. Seeing physical RAM at 82% at idle is a signal that background applications are consuming significant memory — useful for deciding whether a RAM upgrade is warranted or for identifying which process is the primary consumer.
Storage Section — Drive Activity Metrics
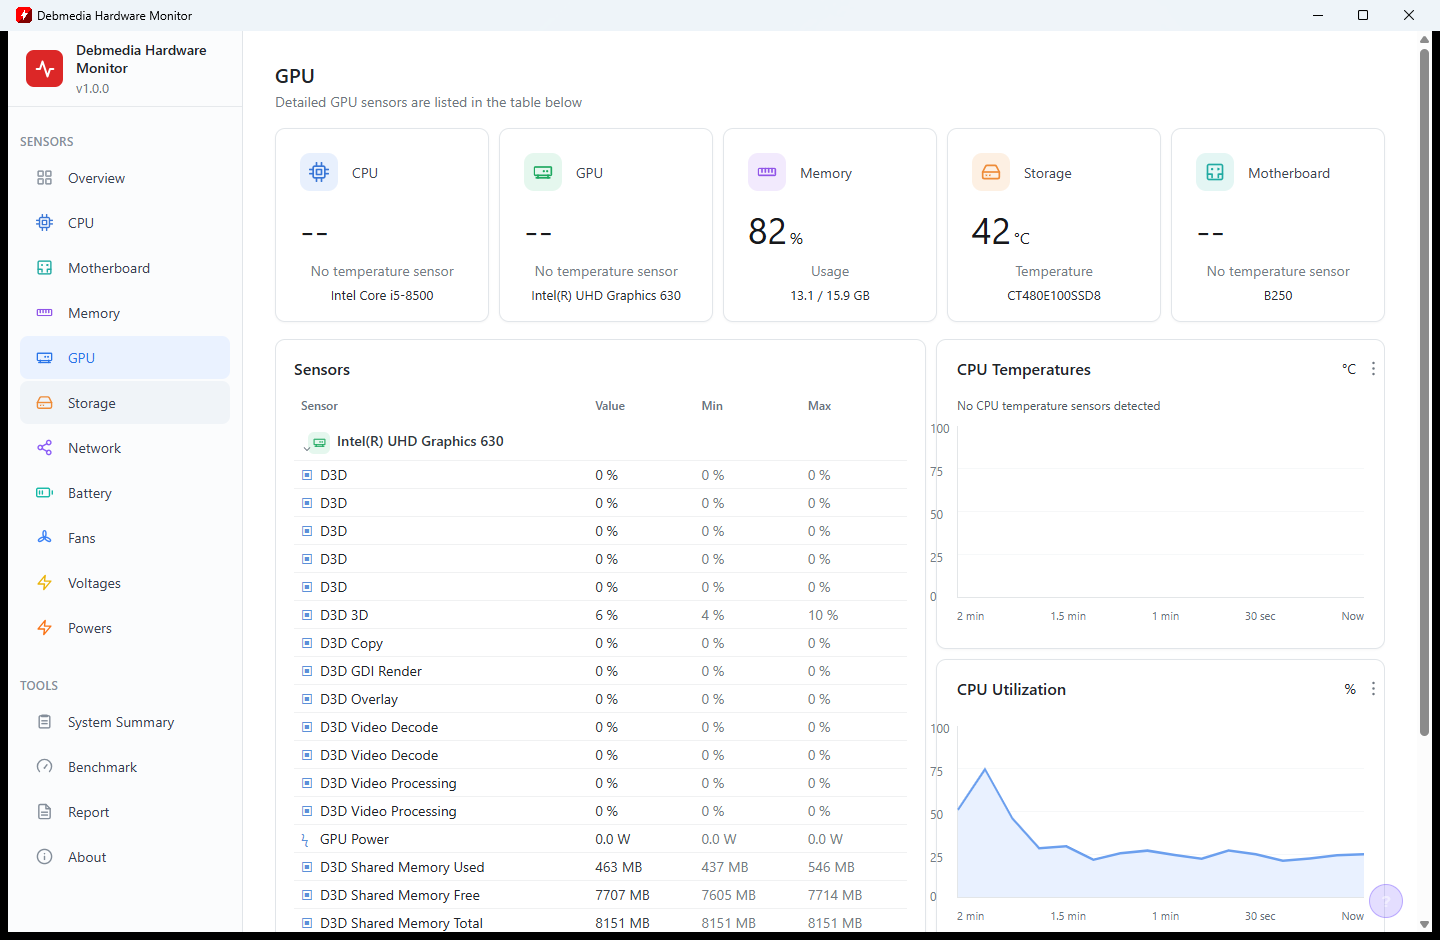
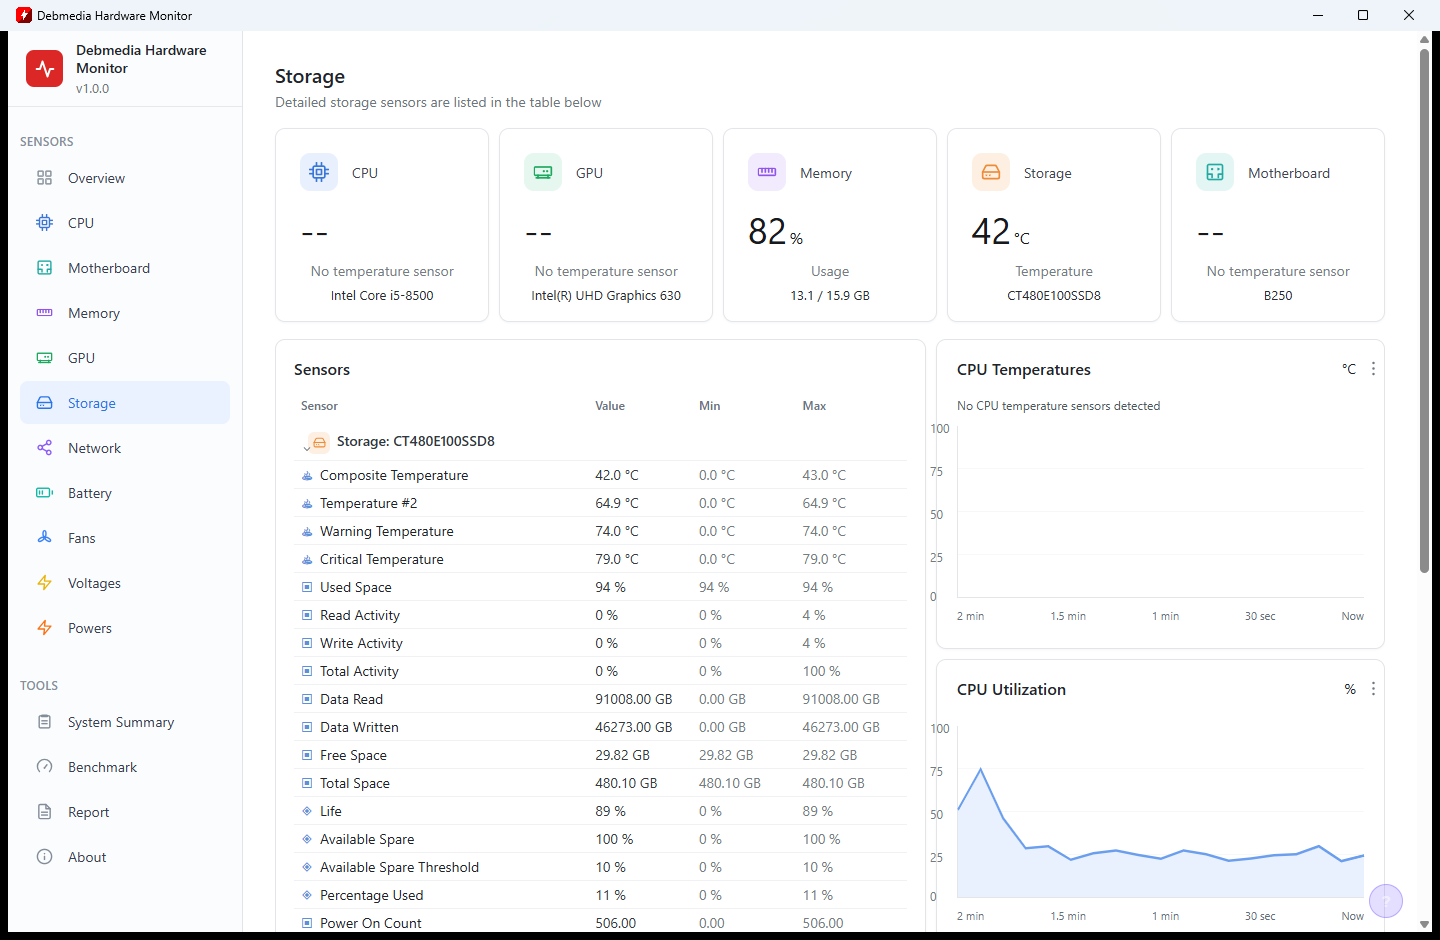
The Storage section covers every drive attached to the system, with each device appearing as its own sub-group in the sensor table. Temperature readings are the most watched metric for drives — NVMe SSDs run hotter than SATA SSDs and HDDs, and sustained temperatures above the warning threshold can accelerate wear and data loss. The read and write activity percentages show whether the drive is currently being accessed heavily, which helps diagnose slowdowns caused by sustained 100% disk utilization.
NVMe SSD Health — Life and Spare Capacity
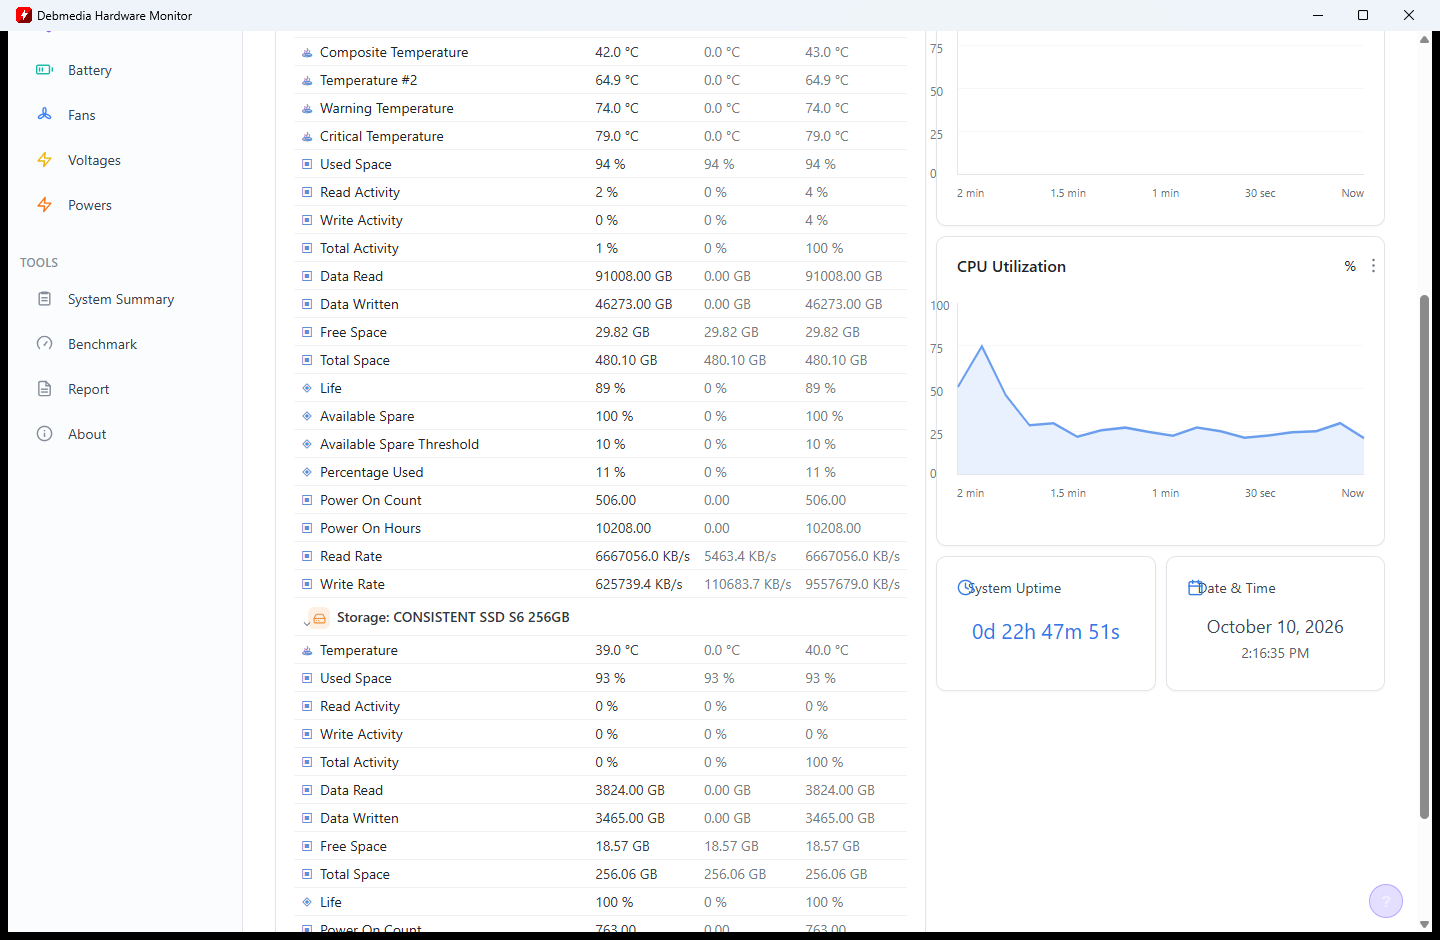
NVMe SSDs expose detailed health data through SMART attributes that most operating system tools do not surface. Debmedia Hardware Monitor reads and displays Life percentage (how much of the drive’s rated write endurance remains), Available Spare (the percentage of replacement blocks the drive has in reserve), and Available Spare Threshold (the point at which the drive considers itself approaching end-of-life). A drive at 100% Available Spare is in excellent health; once Available Spare starts declining, it is time to plan a replacement before failure occurs.
Battery, Voltages and Power Sensors
For laptops and systems with battery monitoring chips, the Battery section shows charge level, design capacity versus full charge capacity (which reveals battery wear over its lifetime), charge rate and estimated time remaining. The Voltages section tracks the individual voltage rails from the power supply or voltage regulator module, and the Power section shows total system power consumption in watts — useful for estimating electricity cost, verifying that the power supply has adequate headroom, and confirming that power management settings are functioning correctly.
Network Monitoring — Coming in a Future Update
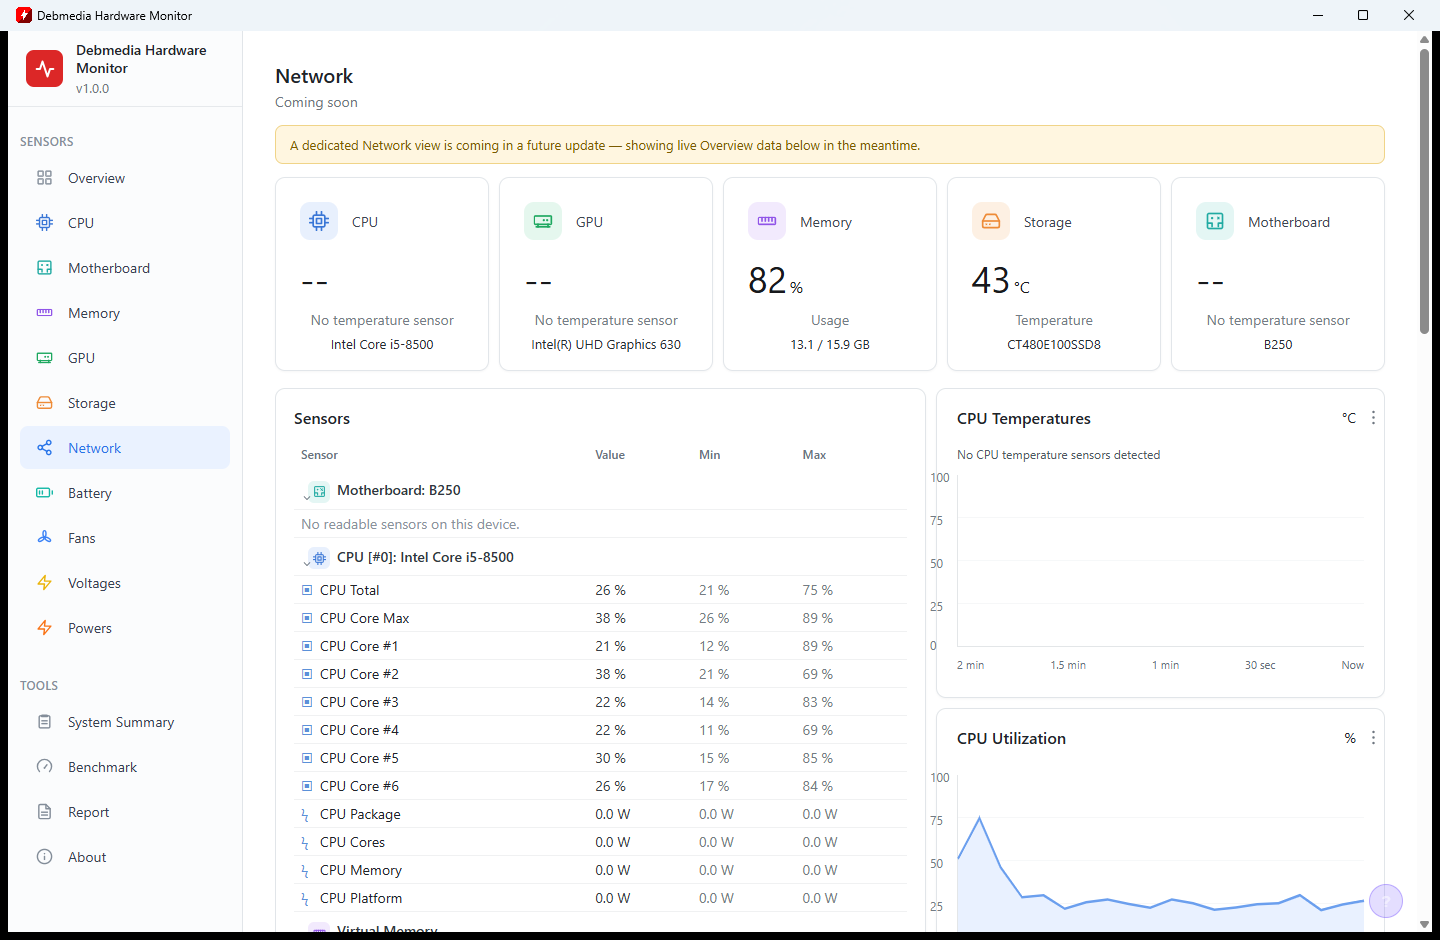
The Network section currently shows a clear informational banner: “A dedicated Network page is coming in a future update — showing live Download/Upload data from the machine.” This transparency about an in-progress feature is appreciated — you know the section exists and what it will do, rather than discovering a blank page with no explanation. When the network monitoring feature ships, it will show per-adapter download and upload rates alongside the rest of the hardware sensor data in the same consistent table format.
Events and System Log Data
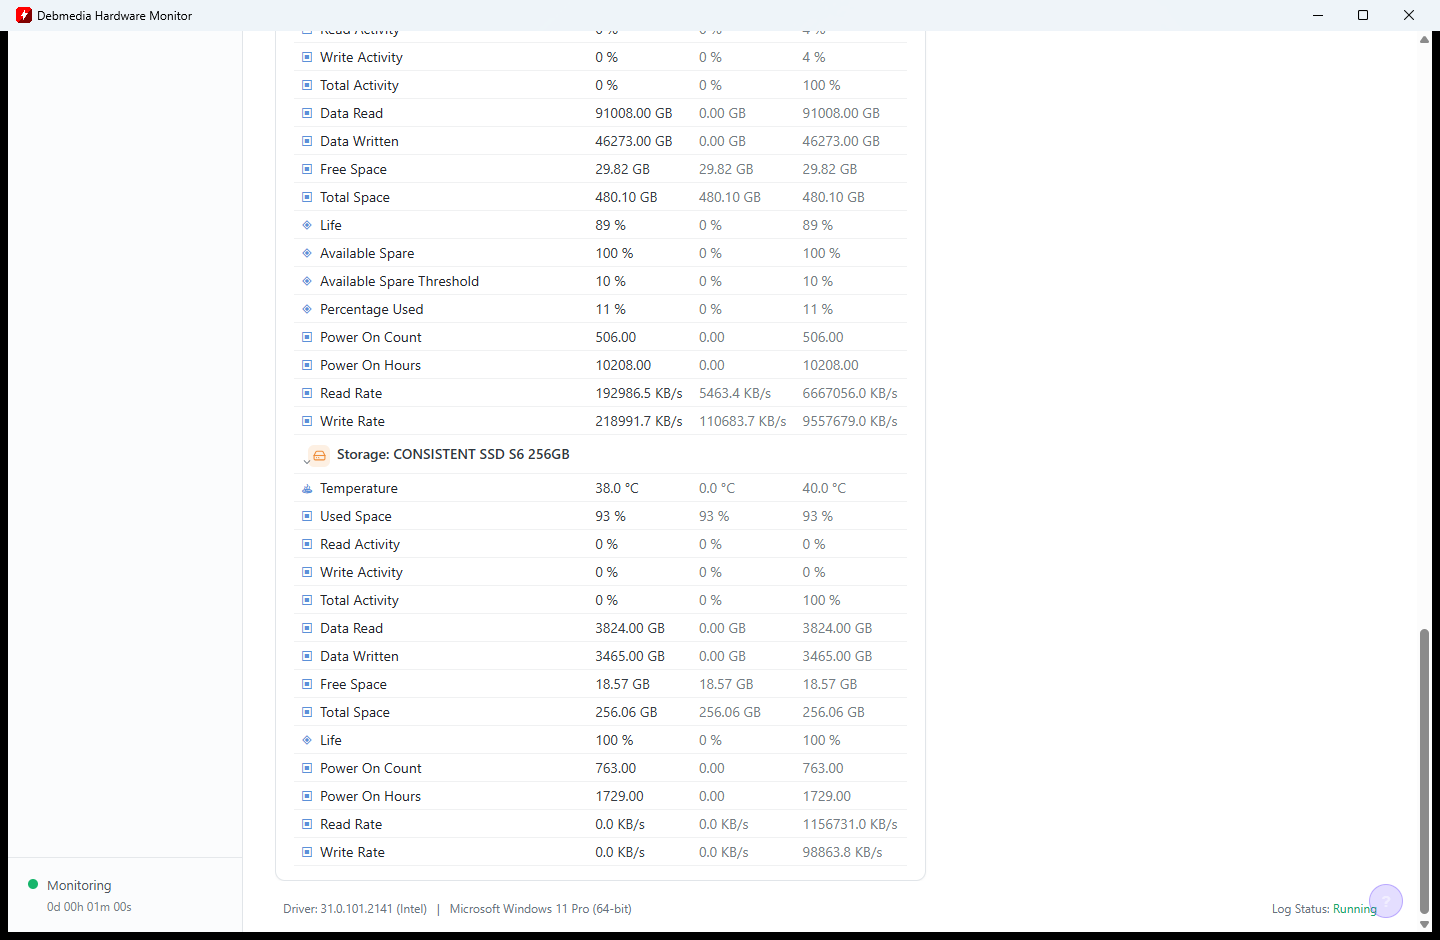
The Events section surfaces system-level events alongside hardware sensor data, allowing you to correlate a thermal spike or a voltage anomaly with a specific system event that occurred at the same time. This cross-referencing capability — combining hardware sensor history with operating system events — is what separates a dedicated monitoring tool from simply reading numbers in the Windows Performance Monitor. Identifying the exact sequence of events that precedes a crash or a performance drop becomes significantly easier when both data streams are visible in one place.
System Summary — All Components in One Table
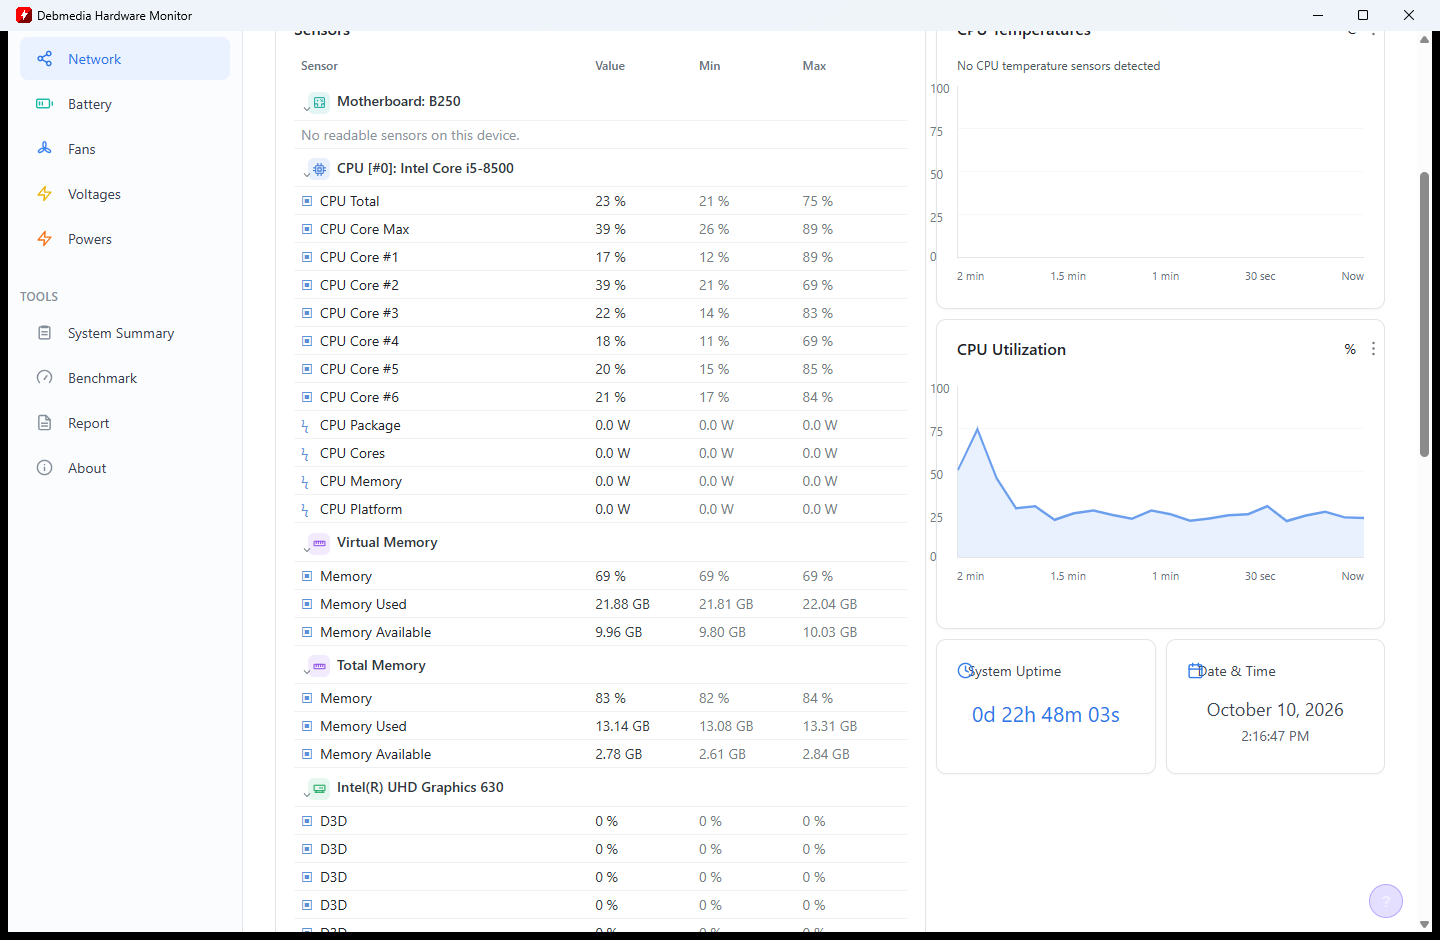
The System Summary view is the most comprehensive screen in the application — every sensor from every component appears in a single scrollable table. CPU Core temperatures for all six cores, Virtual and Physical Memory usage, Intel UHD Graphics 630 sensors, NVMe SSD health data and more are all visible together. The bottom-right panel shows system uptime (2 days 22 hours 48 minutes 53 seconds) and the current date and time (October 13, 2024 at 2:47 PM). This is the screen to screenshot before sending a hardware diagnosis to a support technician — everything they need is on one page.
About — Version and Licensing Information
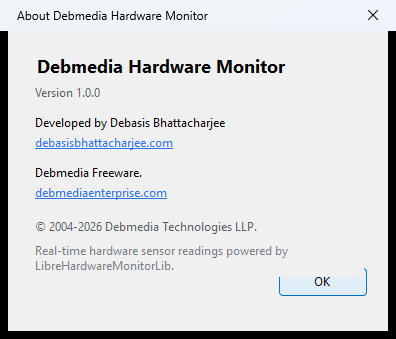
The About dialog confirms the application version (1.0.0), developer (Debasis Bhattacharjee), publisher (Debmedia Technologies LLP, © 2004–2026), website (debmediatechnologies.com) and an important attribution: real-time hardware sensor readings are powered by LibreHardwareMonitor.dll. Debmedia Hardware Monitor is released as freeware — no purchase or subscription required to use the full feature set.
Who Is Debmedia Hardware Monitor For?
- PC enthusiasts and overclockers — Monitor per-core temperatures, voltage rails and power consumption in real time while pushing hardware to its limits, with min/max tracking to capture peak values during benchmark runs.
- IT administrators and technicians — Diagnose thermal throttling, failing drives, voltage instability and memory pressure across client machines without installing multiple separate monitoring tools.
- Laptop users — Track battery health degradation over time, monitor temperatures to understand why the fan is running at full speed, and identify which process is driving high CPU load and heat.
- Content creators and gamers — Confirm that the system is running cool and stable before a long recording session or gaming session, and verify that cooling upgrades have had the intended effect.
- General users who want visibility — See at a glance what is happening inside the PC without needing to understand BIOS menus or third-party scripts.
System Requirements
- Operating System: Windows 10 (64-bit) or Windows 11
- Processor: Any modern x64 processor
- RAM: 4 GB minimum
- Storage: 80 MB for the application
- Privileges: Administrator rights required for deep hardware sensor access
- Runtime: .NET Desktop Runtime 6.0 or later (included if not present)
- Internet: Not required — fully offline
Frequently Asked Questions
Why does the app show a SMBIOS/WMI warning on startup?
Some hardware configurations or virtual machines restrict access to certain SMBIOS or WMI data sources. The warning is informational — the sensor data that can be read is still displayed accurately. On most physical machines running Windows 10 or 11, all sensors load without warnings.
Does Debmedia Hardware Monitor modify any system settings?
No. It is a read-only monitoring tool. It reads hardware sensor values through the LibreHardwareMonitor library and displays them — it does not write any values, change any settings or affect system performance in any measurable way.
How often do the sensor values refresh?
Sensor values update automatically at a regular polling interval (typically every 1–2 seconds). The min/max columns track the session extremes across all readings since the application was opened, so they capture brief spikes that might not be visible in a single snapshot.
Can I export the sensor data?
The Report section in the sidebar generates a printable summary of your current hardware sensor readings that can be saved or shared, useful for warranty claims, support tickets or hardware purchase decisions.
Know Exactly What Is Happening Inside Your PC
Most Windows users have no idea whether their CPU is running at 45°C or 95°C, whether their SSD has 5% life remaining or 95%, or whether their RAM is quietly exhausted while a hundred browser tabs are open. Debmedia Hardware Monitor changes that with a single free application that surfaces all of this information in a clean, readable interface — no command lines, no BIOS menus, no third-party scripts. Install it once and you will always know exactly what your hardware is doing and whether it is healthy.
Download Debmedia Hardware Monitor free — installs in under a minute, requires no subscription, and starts monitoring your PC immediately.
Download HW Monitor++
Real-time hardware monitoring — temperatures, voltages, fan speeds and usage