Event Log Analyzer
Search, filter and analyze Windows Event Logs — fast and offline
Event Log Analyzer reads and analyzes Windows Event Logs entirely on your local machine — no data leaves your PC. Load logs from the live Windows Event Log system or import saved EVTX files for offline analysis. Filter events by severity level, event source, event ID, date range or free-text keyword search. The dashboard gives you an instant statistical overview — event counts by level, top sources, event frequency over time and a severity distribution chart. Drill into any event for the full XML detail. Export filtered results to CSV or HTML report. Built for IT administrators, developers and power users who need to diagnose system issues, track security events or audit Windows behavior without sending data to an external service.
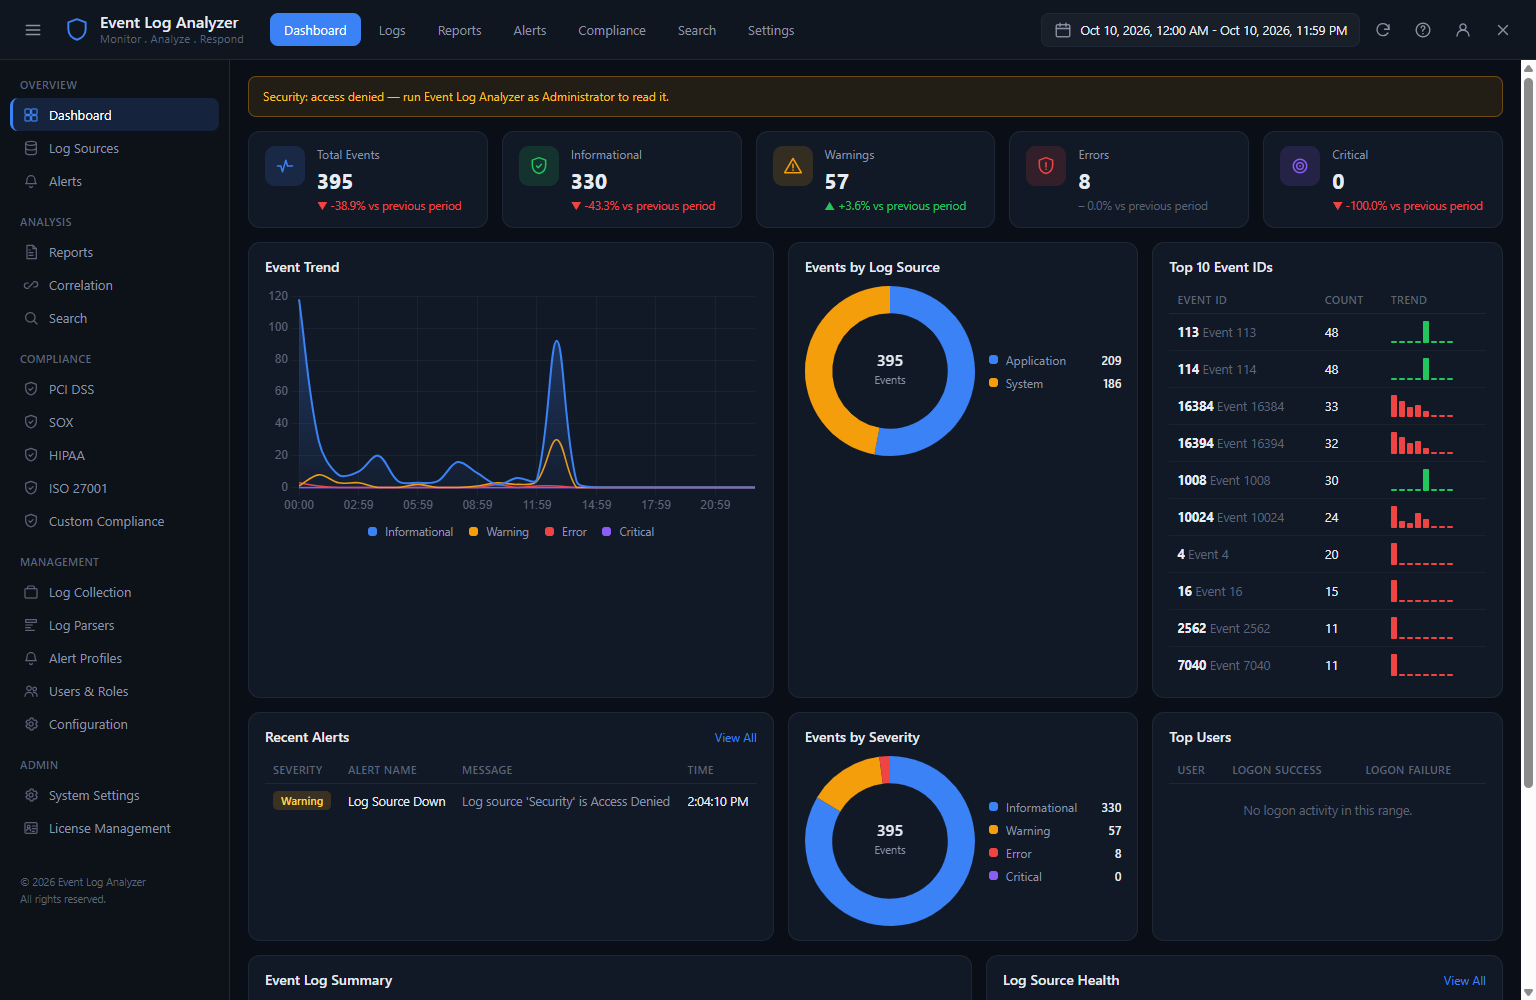
See Event Log Analyzer in Action
A clean, modern interface designed for real-world use.
Eventloganalyzer screen 01 screenshot
What Is Event Log Analyzer?
Event Log Analyzer is a Windows desktop application that transforms the raw, difficult-to-navigate Windows Event Log into an actionable security and operational intelligence tool. It reads all Windows event channels — Security, Application, System and Setup — and presents the data through a rich analytics dashboard with trend charts, donut charts by event source, top event ID tables, severity breakdowns and compliance reports. Security professionals, IT administrators and system auditors can use it to monitor authentication activity, detect anomalous behaviour, generate PCI DSS and other compliance reports, and configure real-time alerts for critical event conditions — all without sending log data to a cloud service.
Screen-by-Screen Feature Walkthrough
Analytics Dashboard — Full Security Intelligence Overview
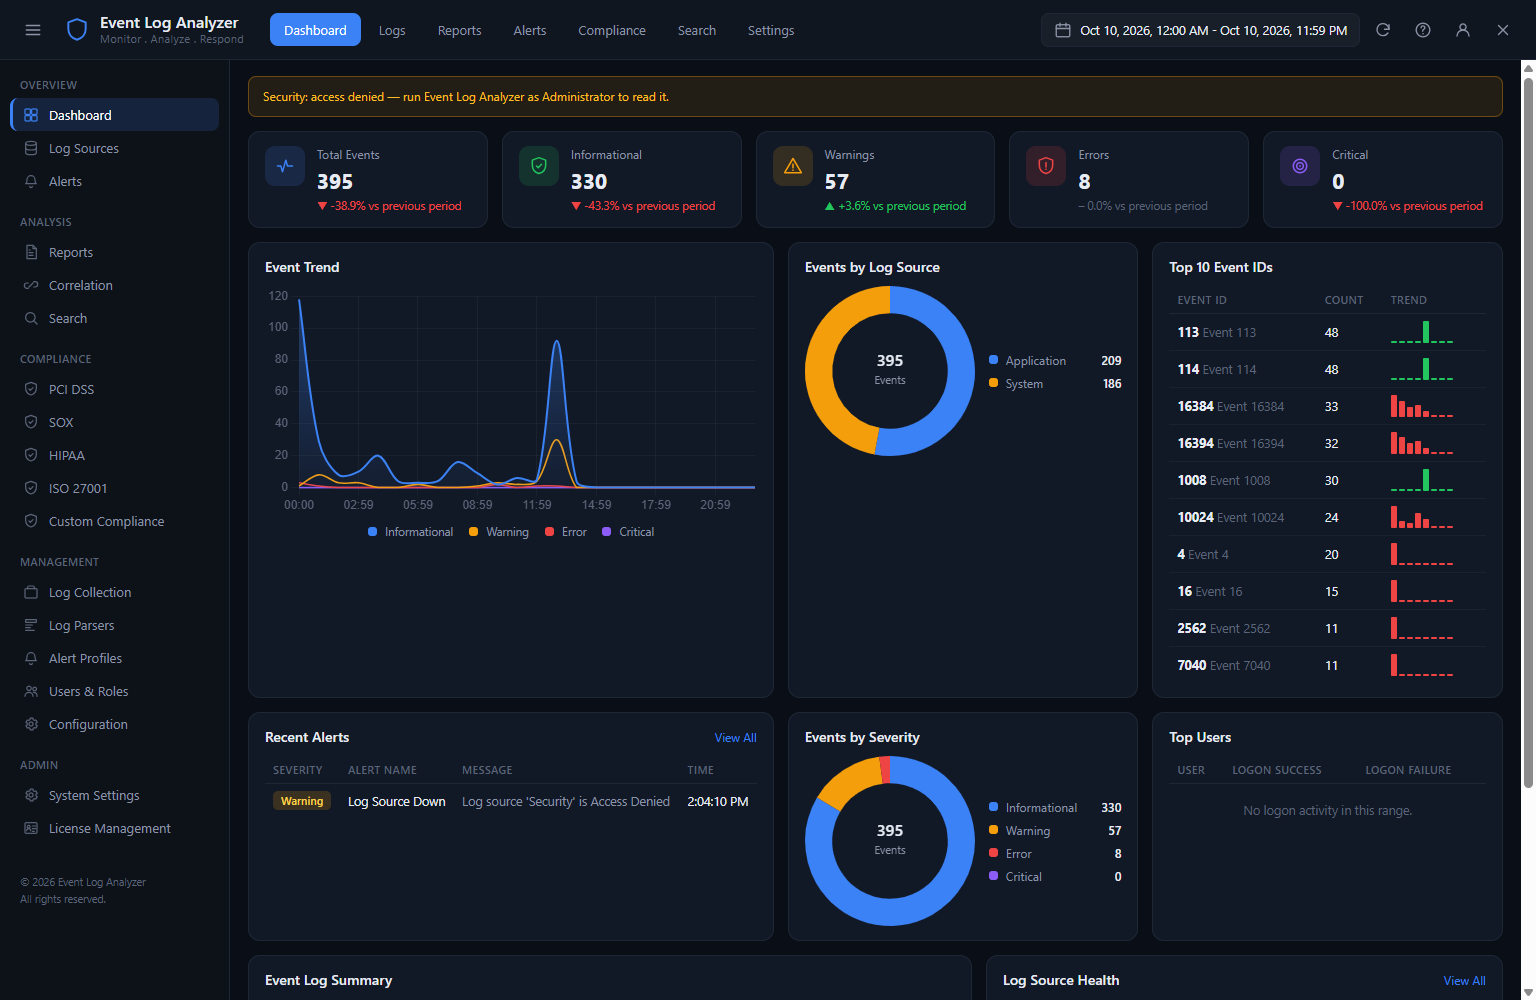
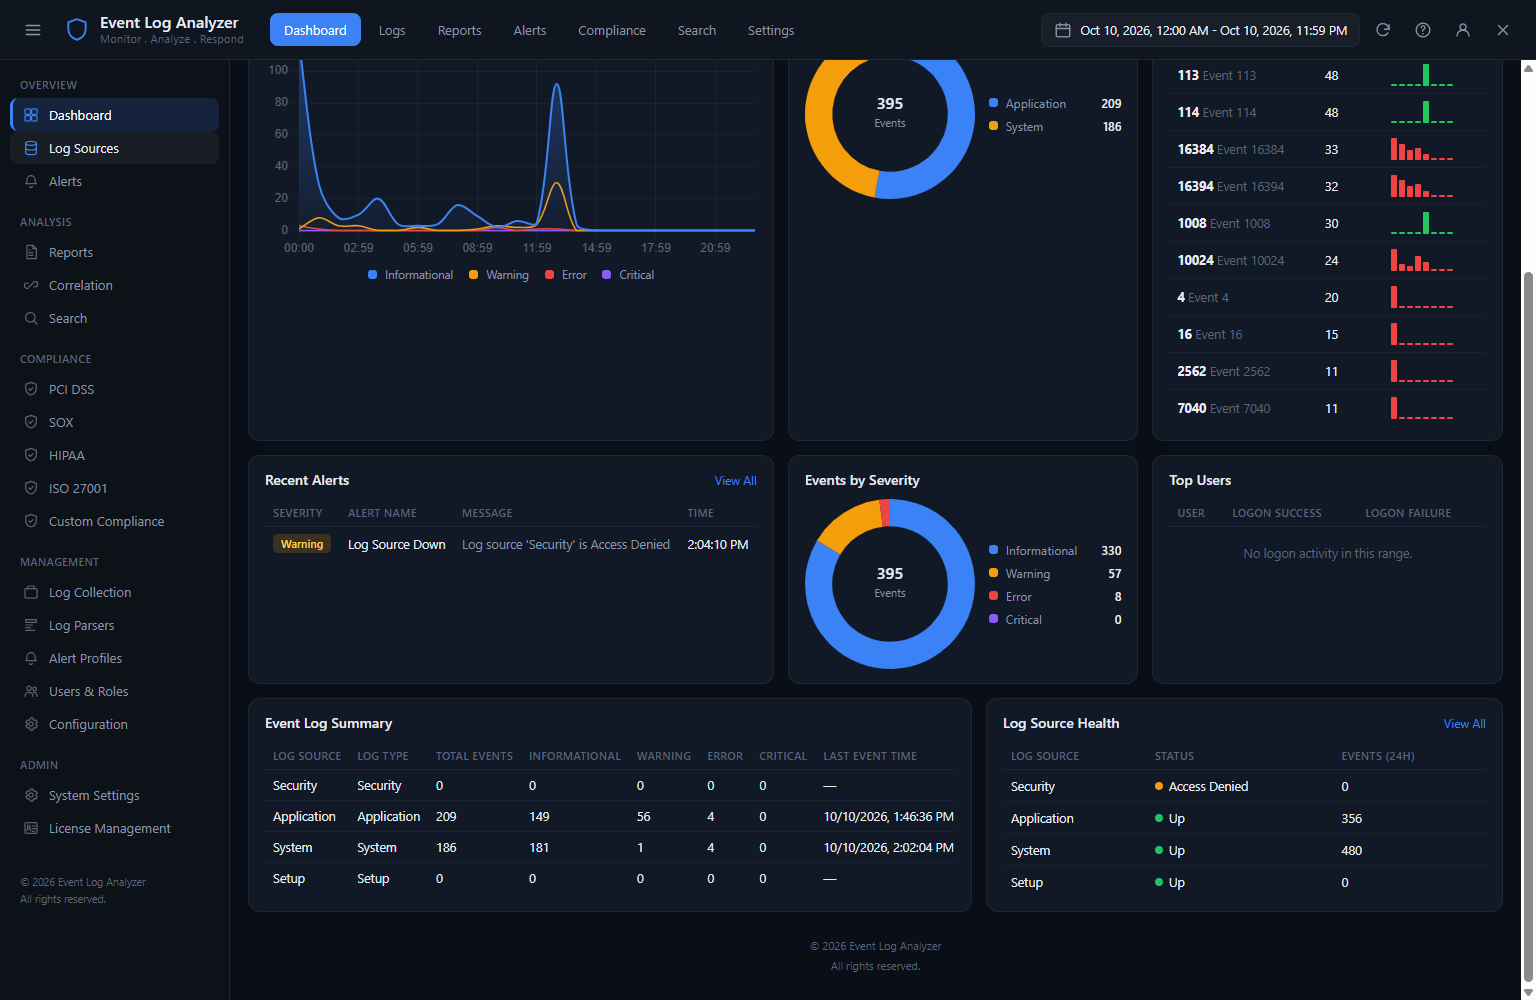
The analytics dashboard is the most information-dense screen in the application, presenting eight distinct data panels simultaneously. An event trend line chart across the top shows the total event volume over time, making spikes and anomalies immediately visible. A By Source donut chart shows the proportion of events from Security, Application, System and Setup channels. The Top 10 Event IDs table shows which specific event codes are firing most frequently — this is critical for security monitoring, as unusual spikes in specific event IDs can indicate brute-force attacks, privilege escalation or account lockouts. The Recent Alerts panel surfaces the most critical events requiring immediate attention. Severity breakdown, Top Users (accounts generating the most events) and a Log Summary table complete the picture.
Dashboard — Event Trend and Source Distribution
The event trend chart and source distribution panels work together to establish your baseline. A healthy system has a relatively consistent event volume day-to-day; a sudden spike — particularly in Security events — is the most common early indicator of an authentication attack or policy violation. The By Source donut chart shows what percentage of total events comes from each Windows event channel. Security events dominating the distribution is normal for an active domain environment; a system that suddenly shifts to mostly Application or System events when Security events were previously dominant may indicate that Security logging has been disabled — itself a security concern.
Dashboard — Top Event IDs and Alert Summary
The Top 10 Event IDs table is particularly valuable for security monitoring. Key Windows Security event codes tell a specific story: Event ID 4625 (Failed Logon) appearing in the top 10 with a high frequency signals a brute-force or password spray attack. Event ID 4648 (Logon with Explicit Credentials) appearing unexpectedly suggests credential theft usage. Event ID 4740 (Account Lockout) shows which accounts are being targeted. The Recent Alerts panel alongside this table surfaces the most recent high-severity events, giving you the specific events to investigate alongside the statistical context showing how unusual they are.
Dashboard — Log Health and User Activity
Log Health indicators show whether each event channel (Security, Application, System, Setup) is actively collecting events, whether the log files are within acceptable size limits, and whether any collection gaps exist in the timeline. A collection gap — a period where no events were recorded in a channel that should be continuously active — is a significant finding that can indicate tampering or a logging service failure. The Top Users table shows which Windows accounts are generating the most events, useful for identifying accounts with unusual activity volumes compared to their normal baseline.
Reports — Event Log Summary Export
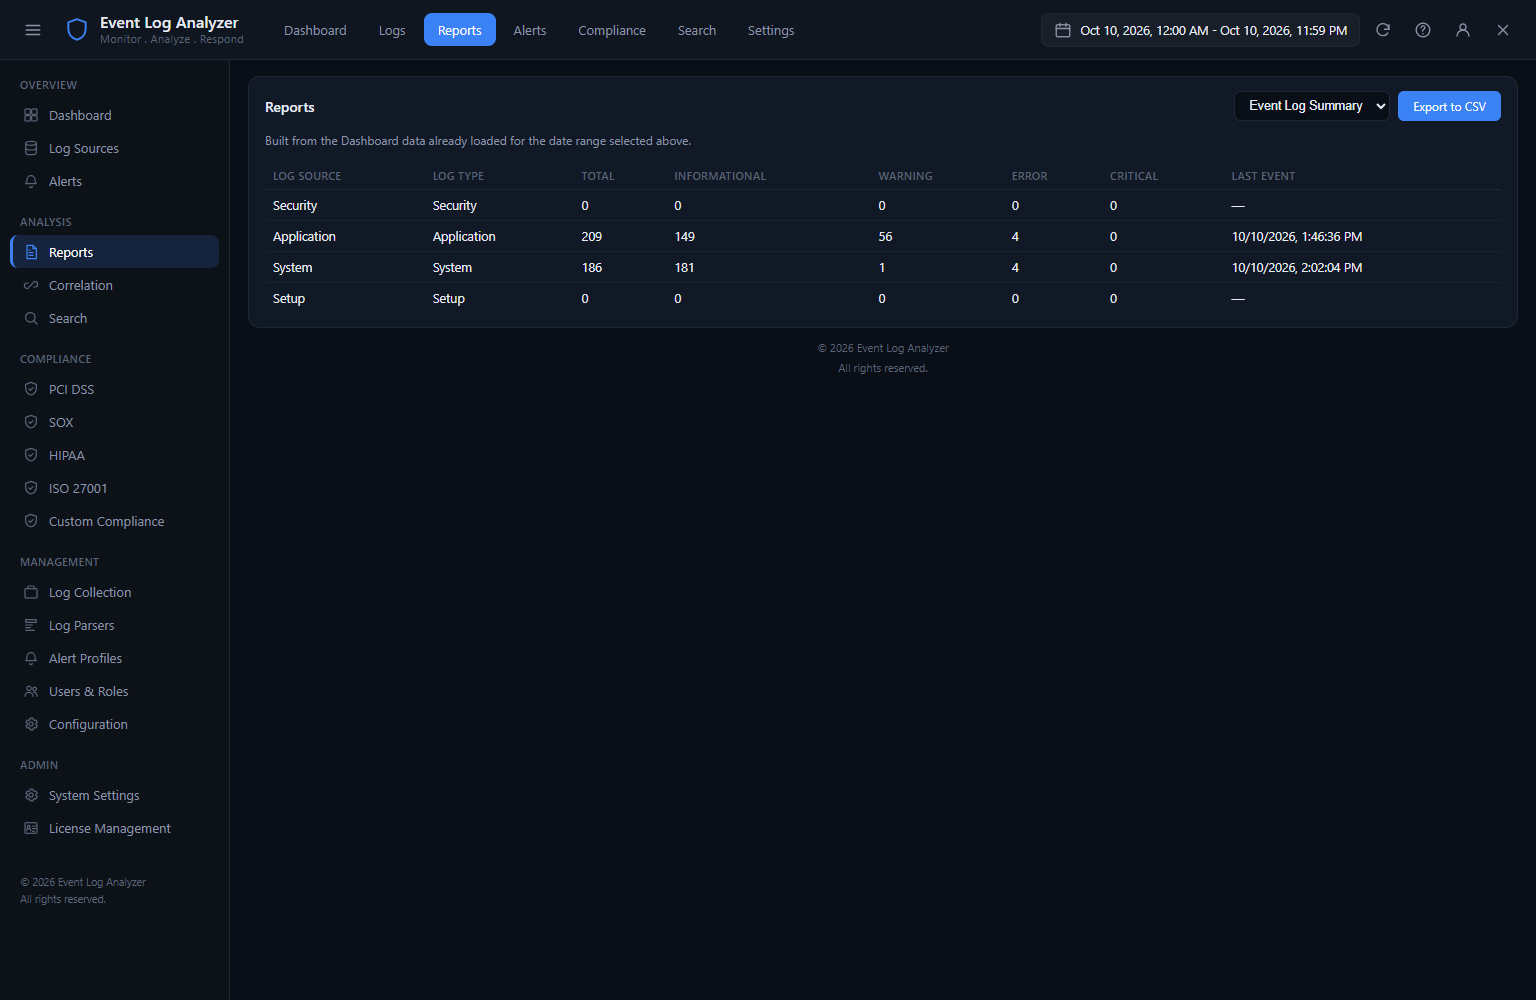
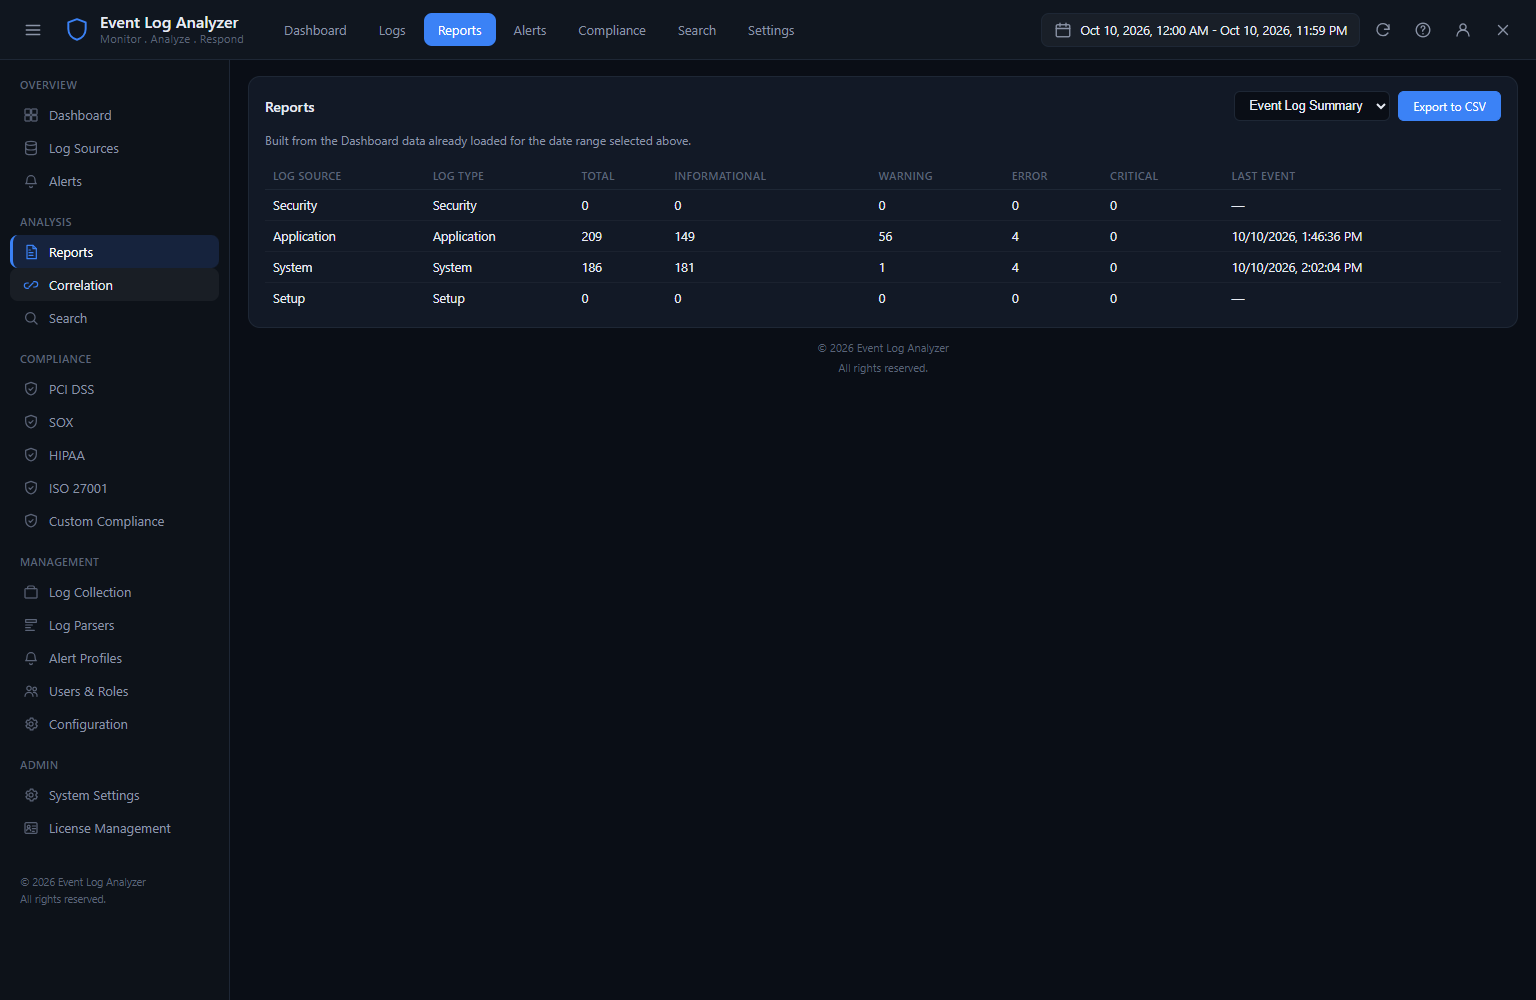
The Reports tab generates a structured summary of the event log data that can be exported as a PDF for documentation, audit submission or management reporting. The EventLog Summary table shows per-channel statistics: total events collected, time period covered, event counts by severity and the most frequent event IDs within each channel. The Export PDF button produces a formatted report suitable for inclusion in audit packages, board-level security updates or compliance submissions where documented evidence of log monitoring activity is required.
Log Browser — Event Viewing and Filtering
The Log Browser provides a tabular view of raw event log entries with per-column sorting and filtering. Each row shows the event timestamp, severity level (Information, Warning, Error, Critical, Audit Success or Audit Failure), source application or service, event ID and the first line of the event message. The filter bar at the top of the table allows filtering by any combination of level, source, event ID, time range and keyword in the message text. This filtered view makes it possible to quickly isolate all authentication failures for a specific account, or all errors from a specific service, across a large event log without writing custom queries.
Log Browser — Advanced Filtering
The advanced filter panel expands to reveal multi-criteria filtering: filter by specific event ID or a range of IDs, by severity level, by source application, by the user account that generated the event, by the computer name (for environments where logs from multiple machines are collected), and by an exact time range down to the minute. Multiple criteria can be combined with AND logic to create very specific queries — for example: all Audit Failure events from the Security channel with Event ID 4625, generated by accounts matching a specific username pattern, in the last 24 hours. The filtered result set updates in real time as criteria are added or changed.
Event Detail — Full Event Record
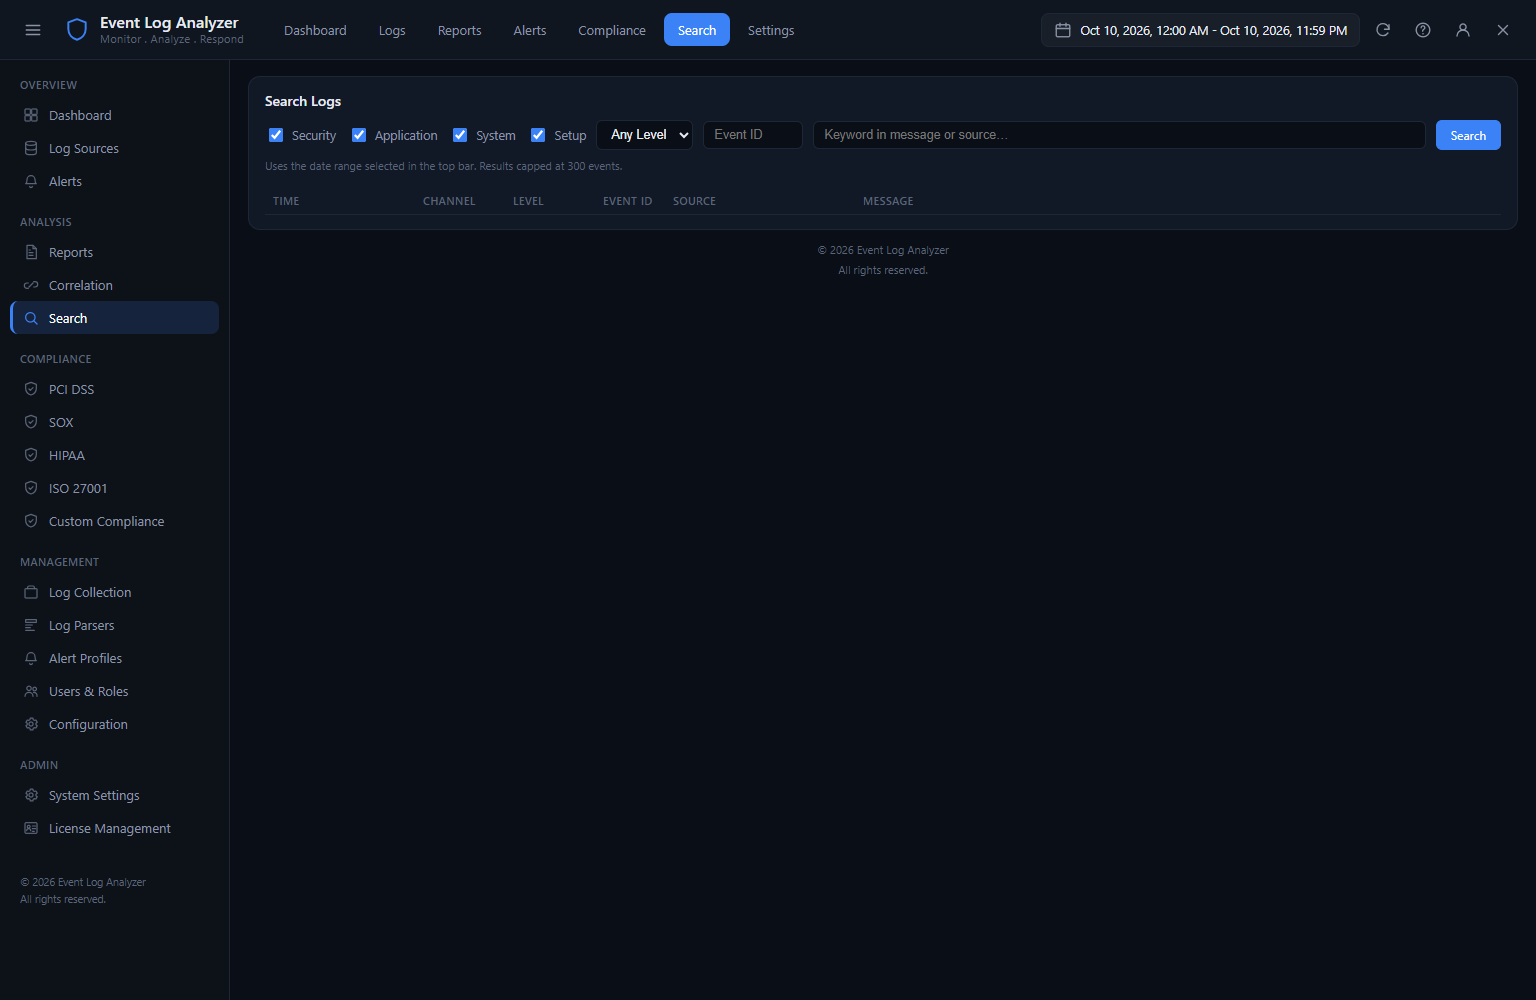
Clicking any event in the Log Browser opens the full event detail panel, which shows every field in the event record: the timestamp, source, event ID, computer, user account, and the complete formatted description text that explains what the event means in plain English. For security events, this description includes details like the account name that attempted a login, the source IP address, the logon type and the failure reason. A Raw XML tab shows the complete unformatted event data exactly as Windows records it. Previous and Next buttons allow stepping through a filtered set of events in sequence without returning to the list.
Log Browser — Filtered Results View
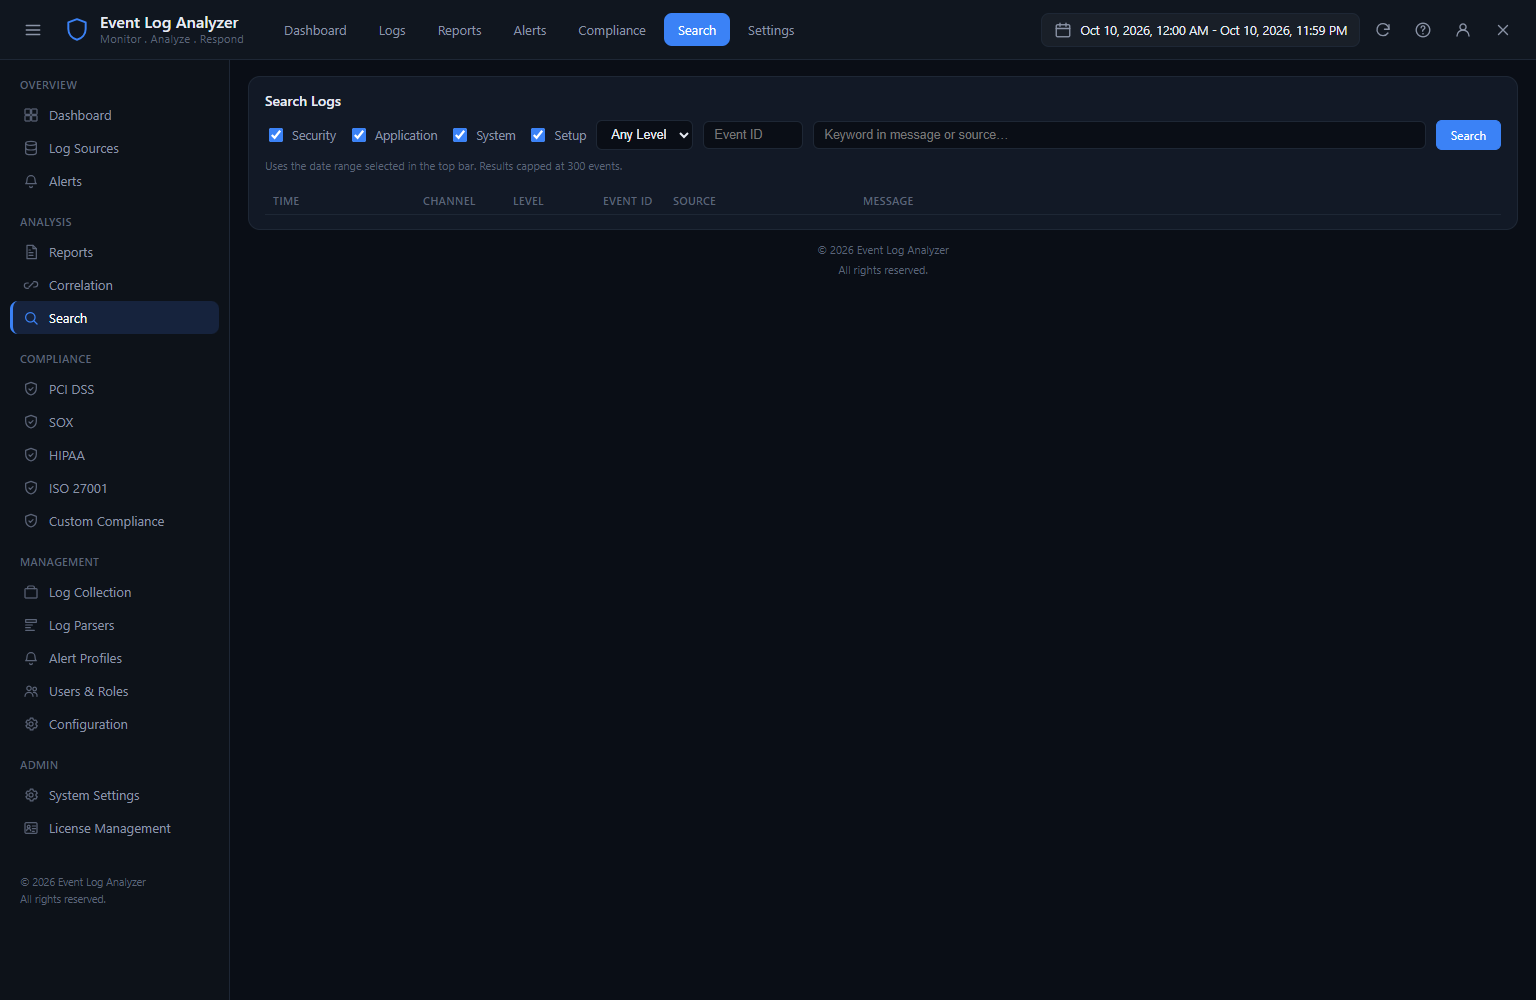
After applying filters, the Log Browser shows only the matching events with a count of matching records displayed in the toolbar. The filtered view retains all the same sorting and selection capabilities as the full list — you can click any filtered event to open its detail, sort by any column within the filtered set, or export the filtered results to a CSV file for analysis in Excel or a SIEM. The filter criteria are displayed persistently at the top of the browser so the active filter context is always visible, preventing confusion about whether you are looking at filtered or unfiltered results.
Compliance — PCI DSS Controls
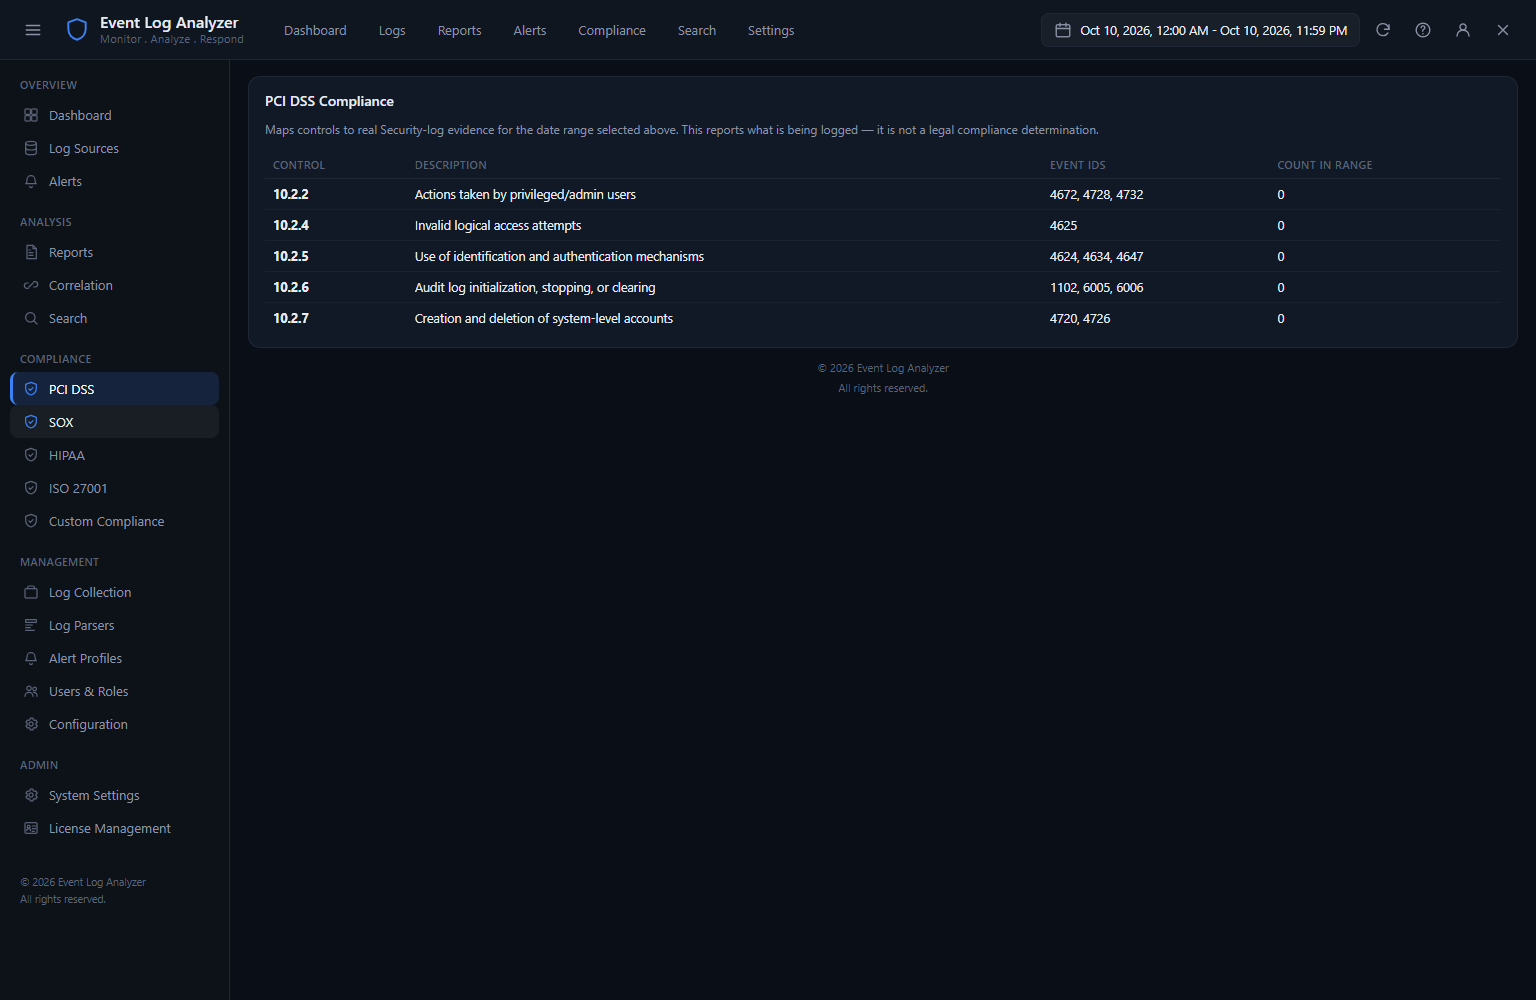
The Compliance section maps Windows event log data to specific regulatory controls. The PCI DSS view shows Requirement 10.2 controls — the PCI Data Security Standard’s requirements for implementing audit trails. Each control (10.2.2 through 10.2.7) is listed with its description, the Windows event IDs that provide evidence for that control, and a compliance status indicator showing whether sufficient evidence was found in the collected logs. For organizations handling card data, this report provides the documentation needed to demonstrate that audit logging meets PCI DSS requirements during an assessment.
Compliance — Additional Frameworks
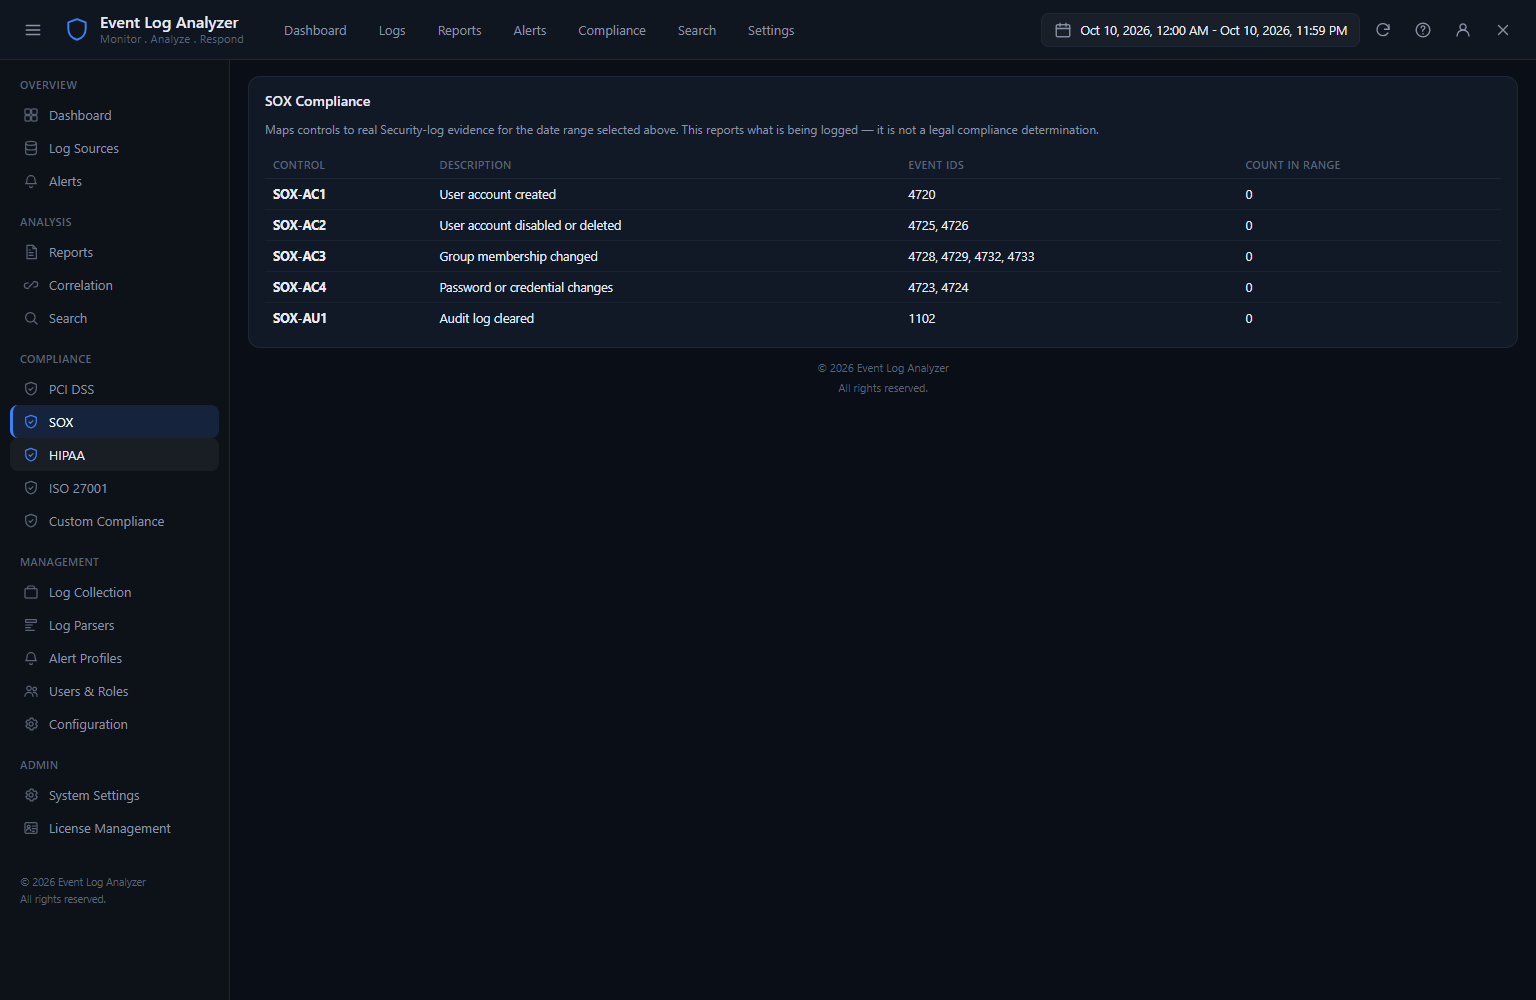
Beyond PCI DSS, the Compliance section covers additional regulatory frameworks that require Windows audit log evidence. Each framework’s requirements are mapped to specific Windows event IDs, and the compliance status for each control is evaluated against the collected log data automatically. The compliance reports are designed to serve as preliminary evidence documentation — showing auditors that specific event types are being monitored and that the required log data exists — rather than replacing a full compliance audit, which typically involves additional controls beyond logging.
Compliance — Control Evidence Detail
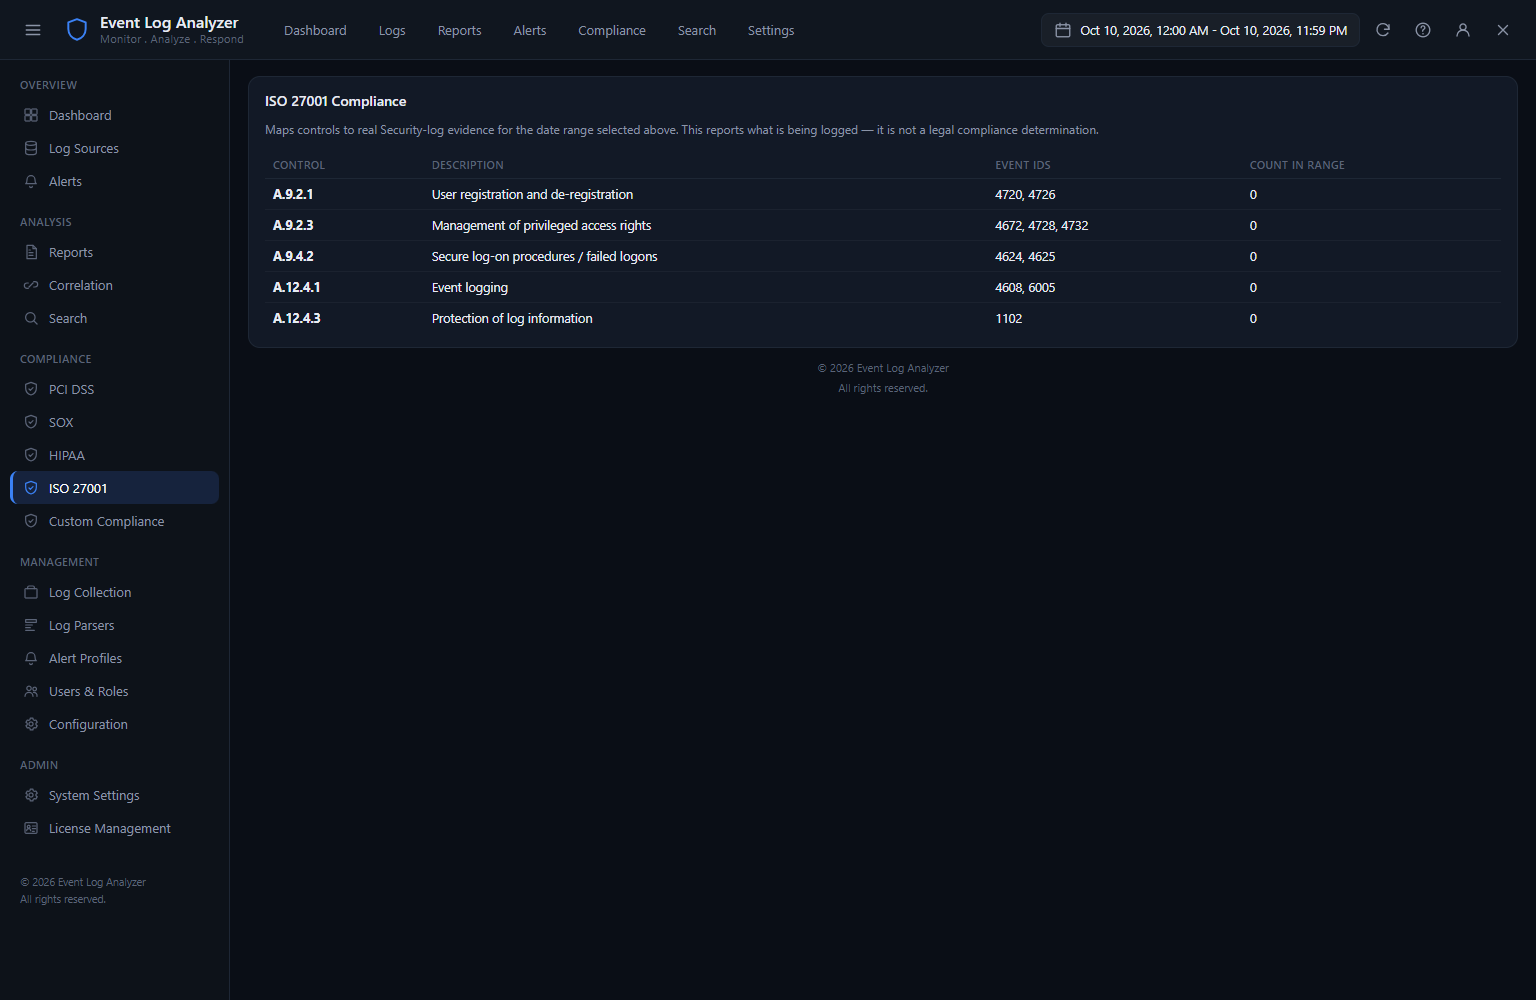
Clicking a compliance control in the compliance table opens a detail view showing the specific events that provide evidence for that control. For a PCI DSS requirement around logging administrative actions, the detail view shows the individual Event IDs (4673, 4674, 4741 etc.) that qualify as evidence, their timestamps, the user accounts involved and the descriptions. This event-level evidence list is what a security auditor or PCI QSA would review to confirm that the required logging is actually occurring and generating appropriate records.
Compliance — Framework Summary
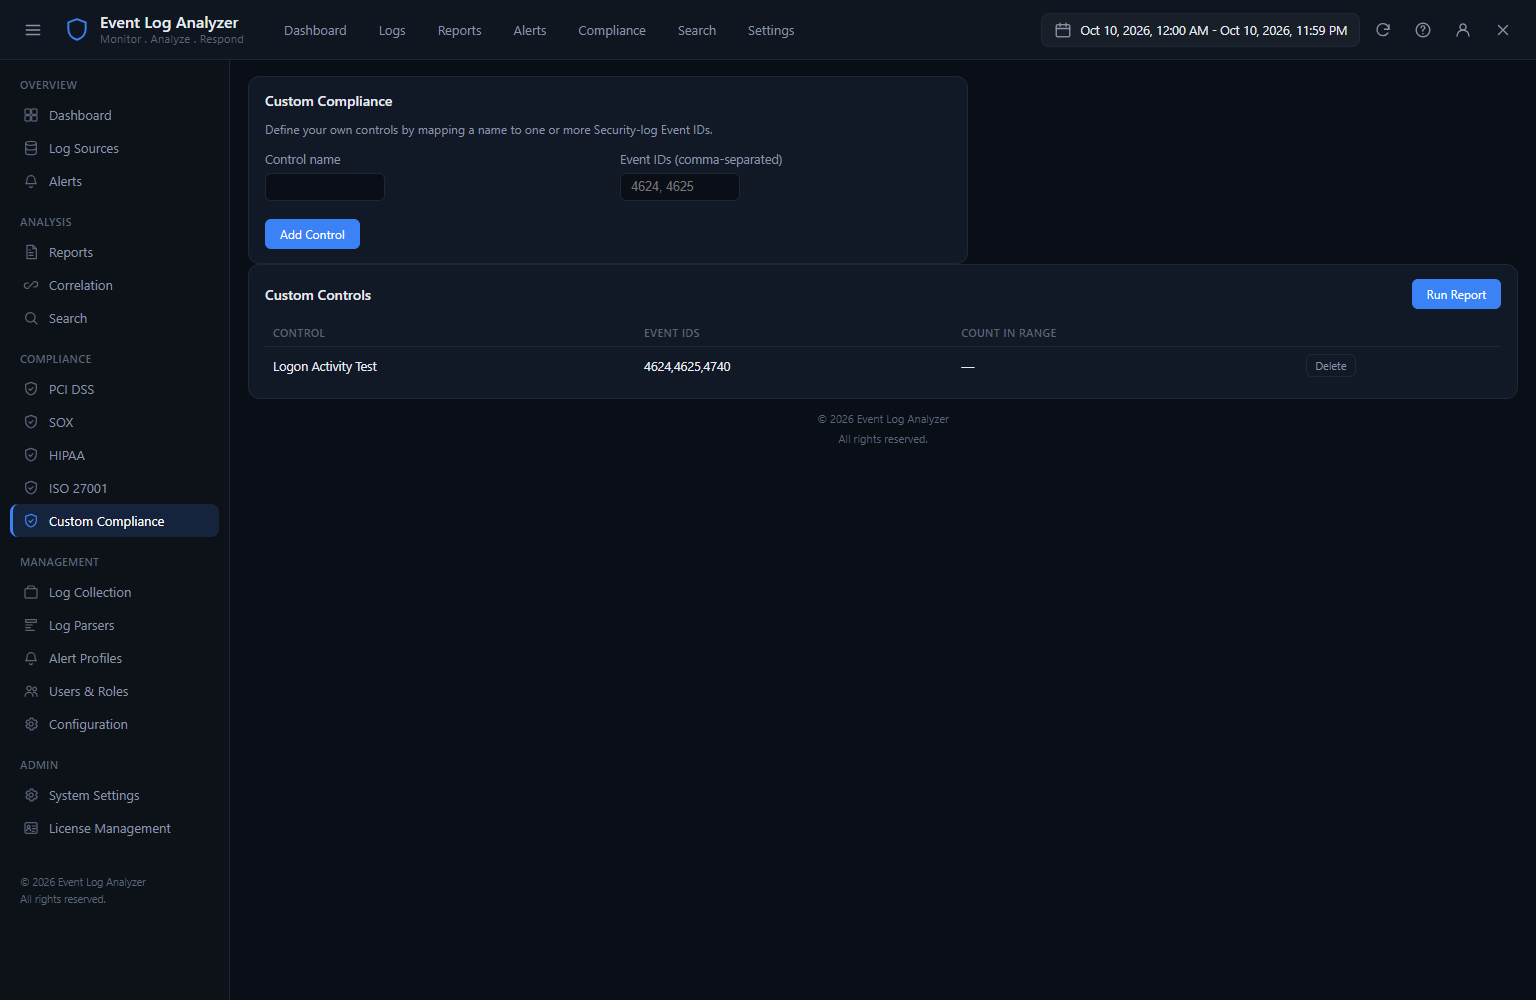
The Compliance Framework Summary provides an overview of compliance posture across all supported frameworks simultaneously. Each framework is shown with a status percentage and the count of controls that have sufficient log evidence versus those with gaps. A green status indicates that the log data collected covers the framework’s requirements; an amber or red status identifies specific controls where log evidence is missing or insufficient. This summary view is useful for quickly identifying which compliance areas need attention before a formal audit or assessment.
Compliance — Detailed Control Analysis
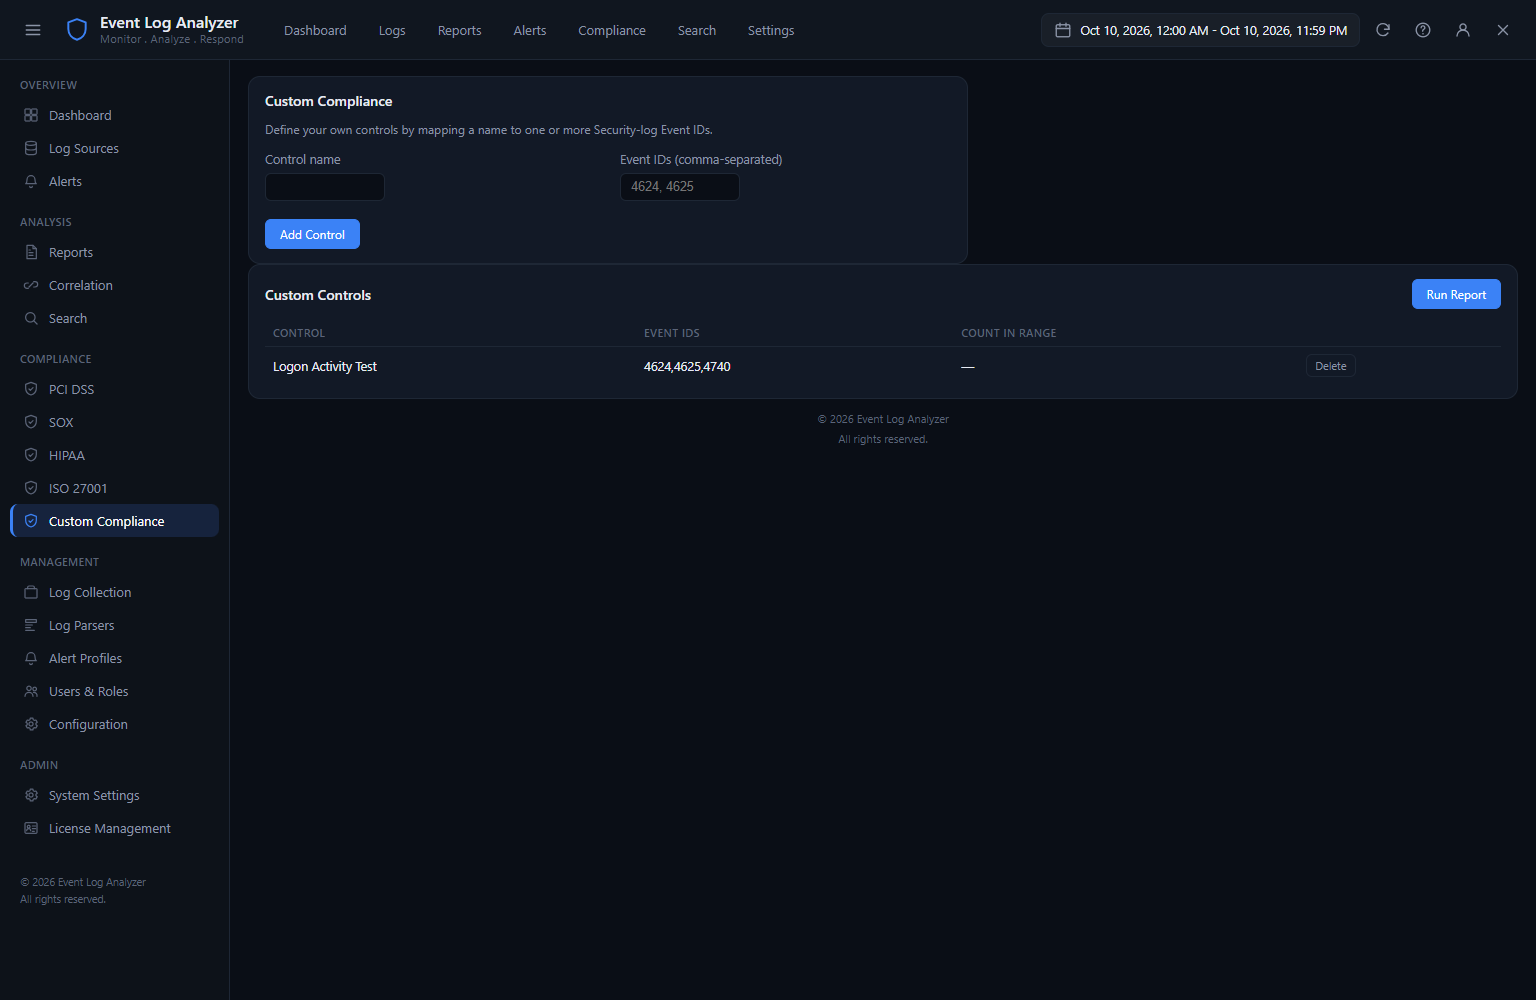
The detailed control analysis view expands each compliance control to show the individual requirements within it, each with its own evidence status. Where evidence is found, the count of relevant events and the date range covered are displayed. Where evidence is missing, the specific event IDs that should be present are listed so the configuration gap can be investigated — for example, if Event ID 4624 (Successful Logon) is missing from the Security log, it likely means that logon auditing is not enabled in the Local Security Policy, which is a configuration change that can be made immediately to fill the compliance gap.
Log Collection — Channel Configuration
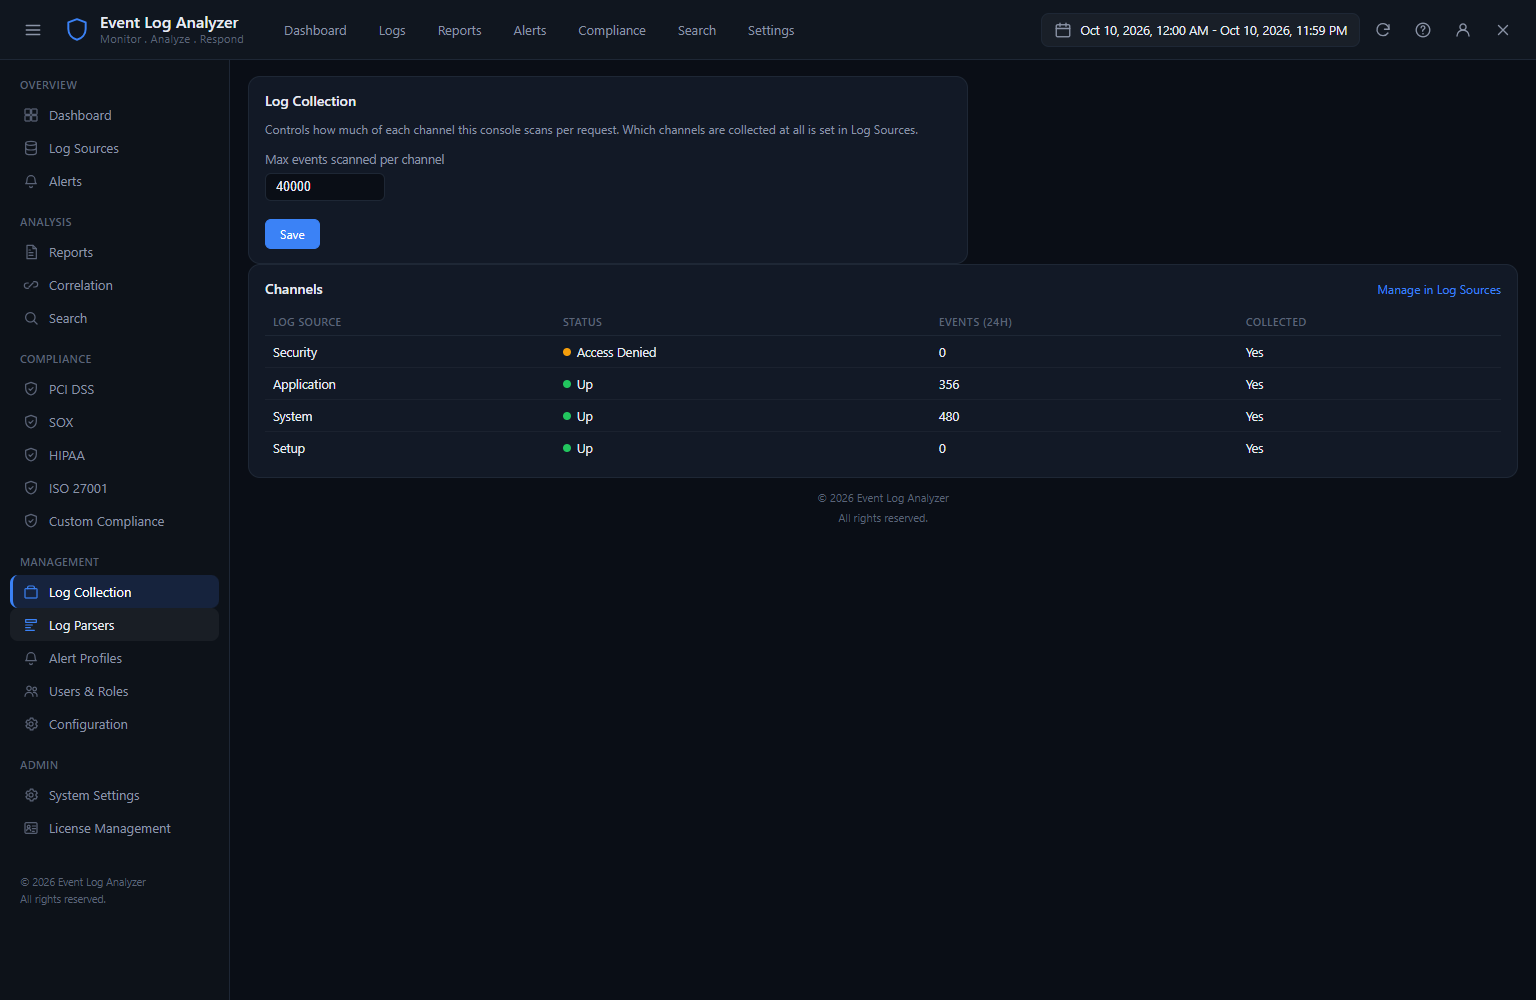
The Log Collection settings screen shows the four primary Windows event channels: Security, Application, System and Setup — each with its current event count, collection status (Active or Paused) and size on disk. This is where you confirm that all required channels are being collected and review how many events each channel contains. The Security channel is typically the largest and most important for security monitoring. For environments with high event volumes, collection can be scoped to specific event ID ranges to reduce storage requirements while retaining the events most relevant to security and compliance monitoring.
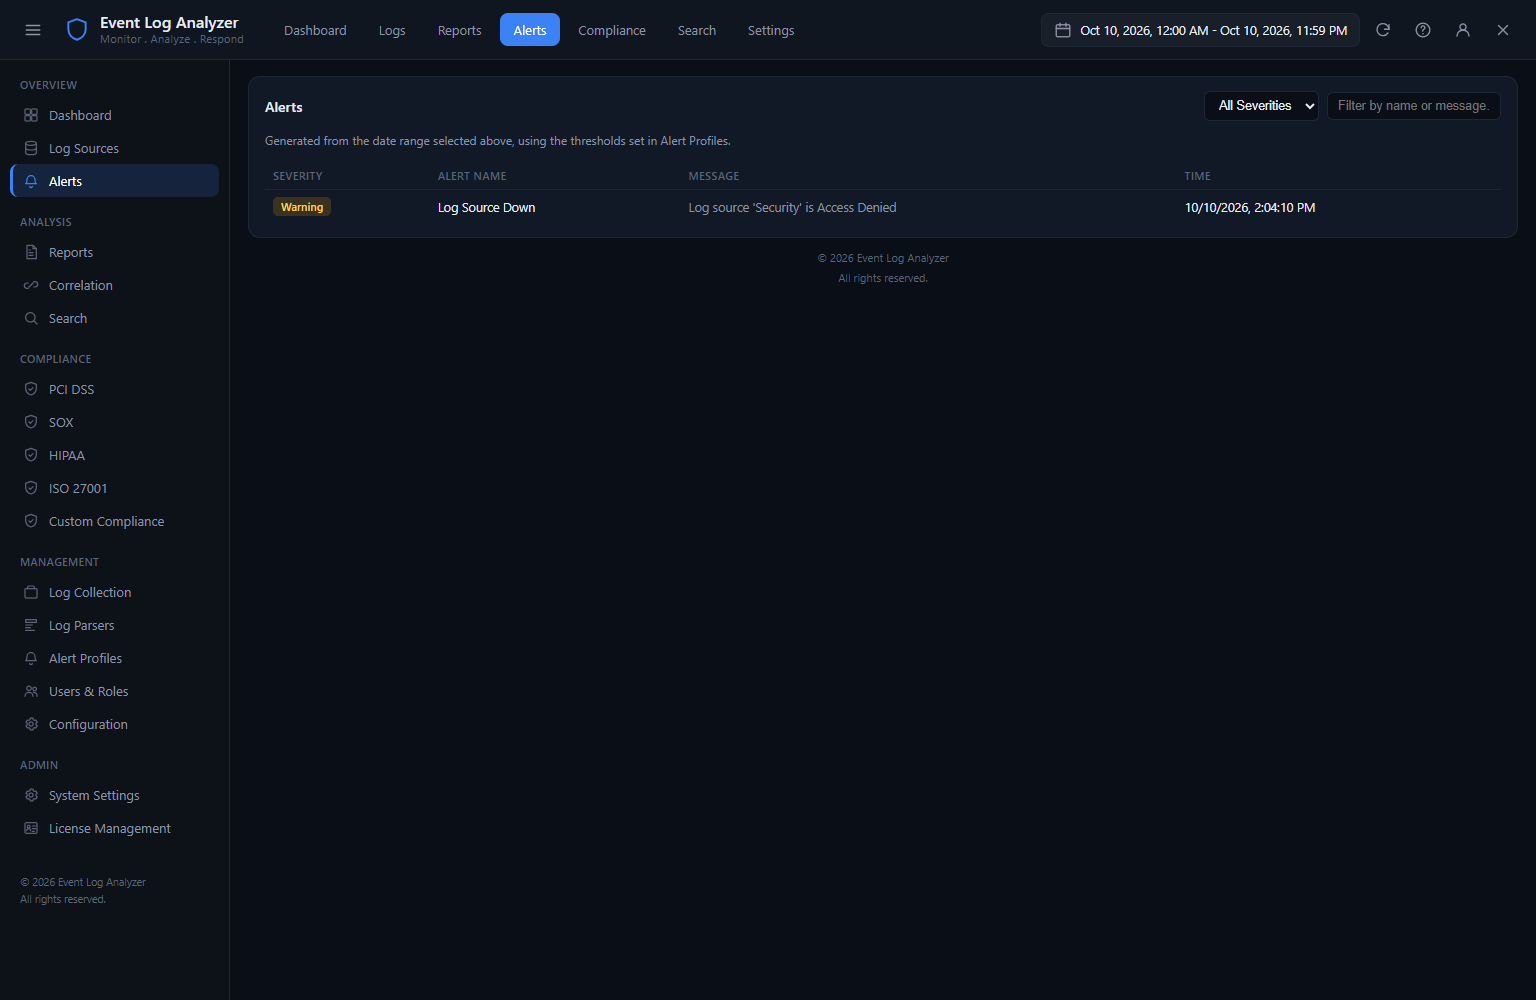
Alert Configuration — Real-Time Security Alerting
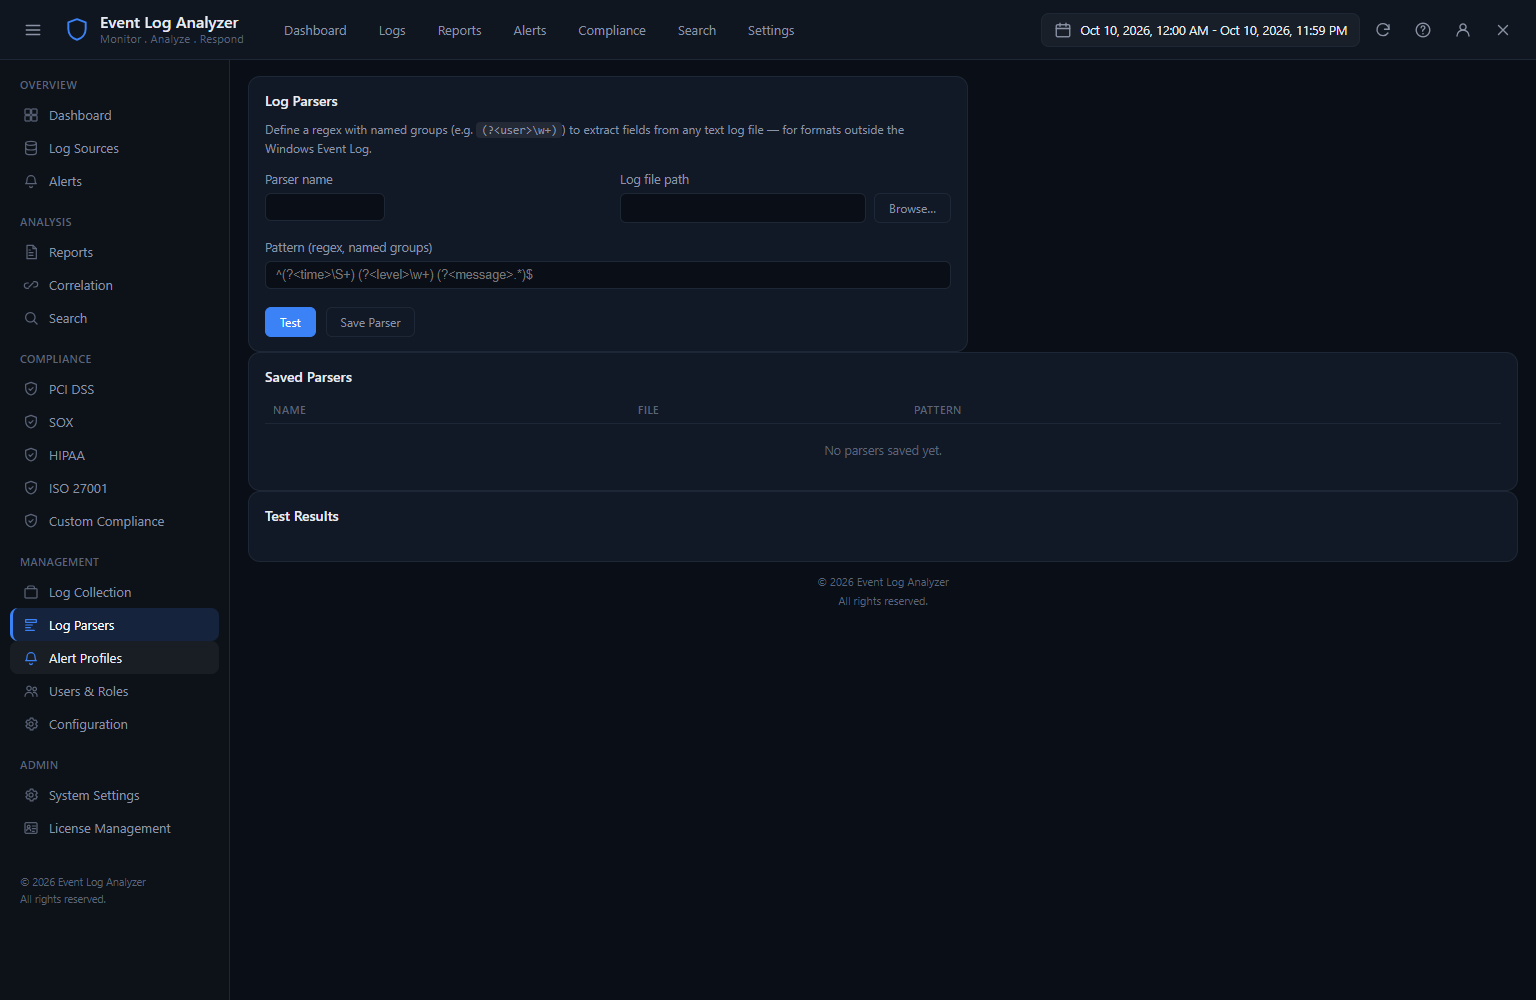
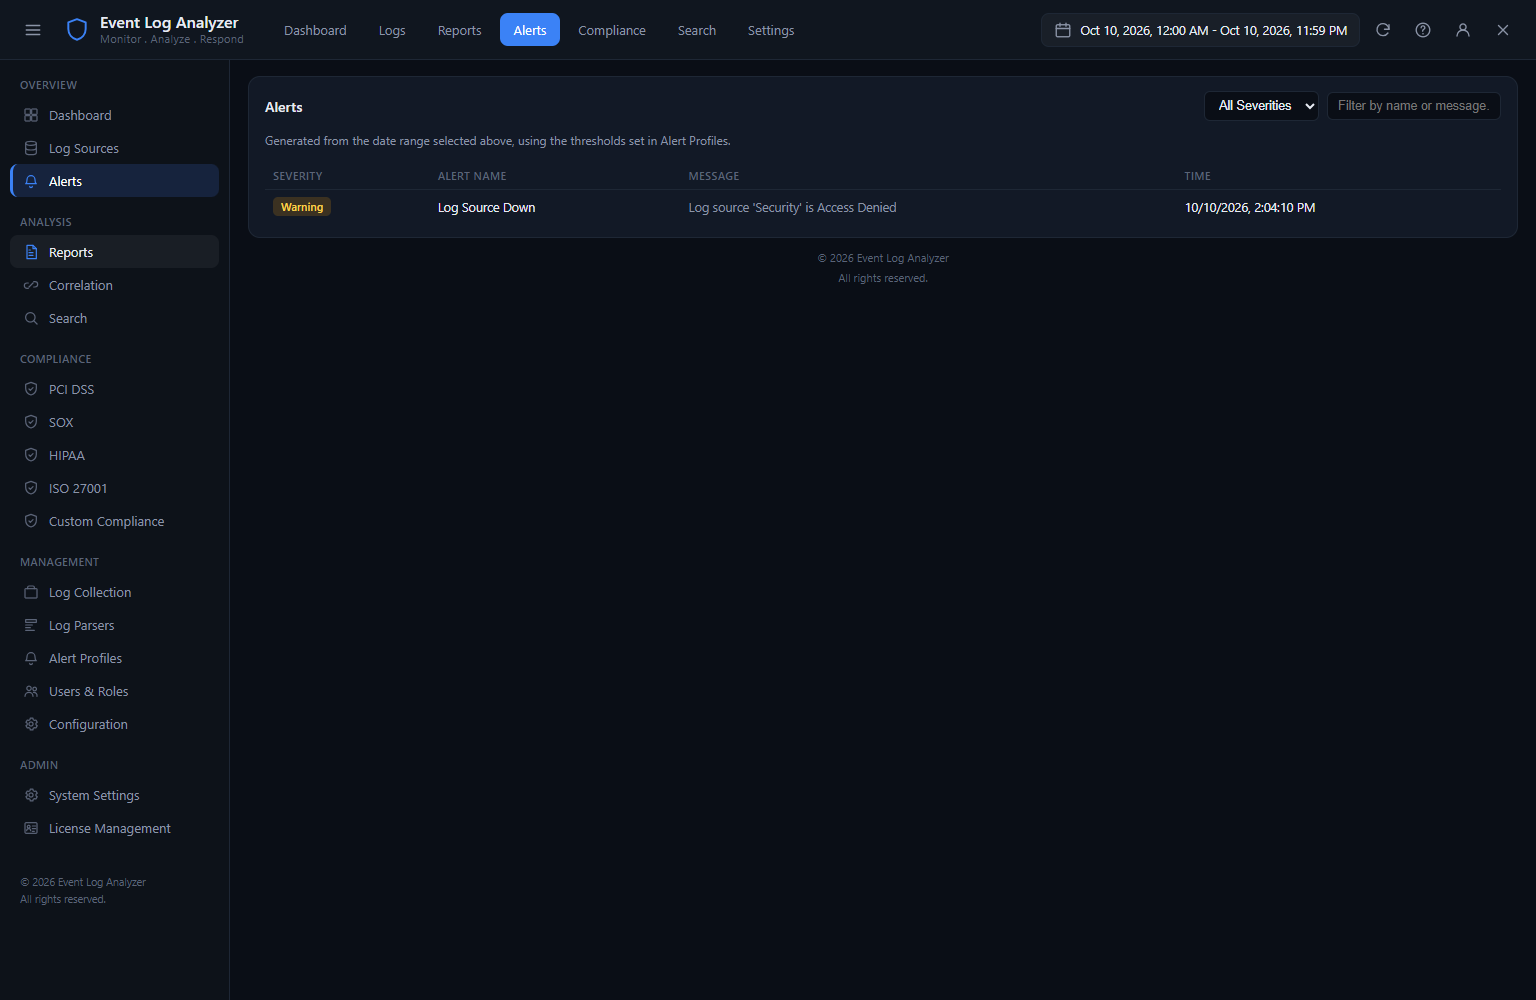
The Alert Configuration panel allows creating rules that trigger notifications when specific event conditions are met in real time. Each alert rule specifies a trigger event ID (or a set of IDs), a threshold (trigger when this event appears more than N times in a rolling time window), and a notification action (show a desktop notification, write to the alert log, or both). Pre-configured alert rules cover the most common security events: mass account lockouts, privilege escalation attempts, audit policy changes and critical service failures. Custom rules can be created for any event ID or combination of conditions that is relevant to your environment.
Settings — Collection and Retention Configuration
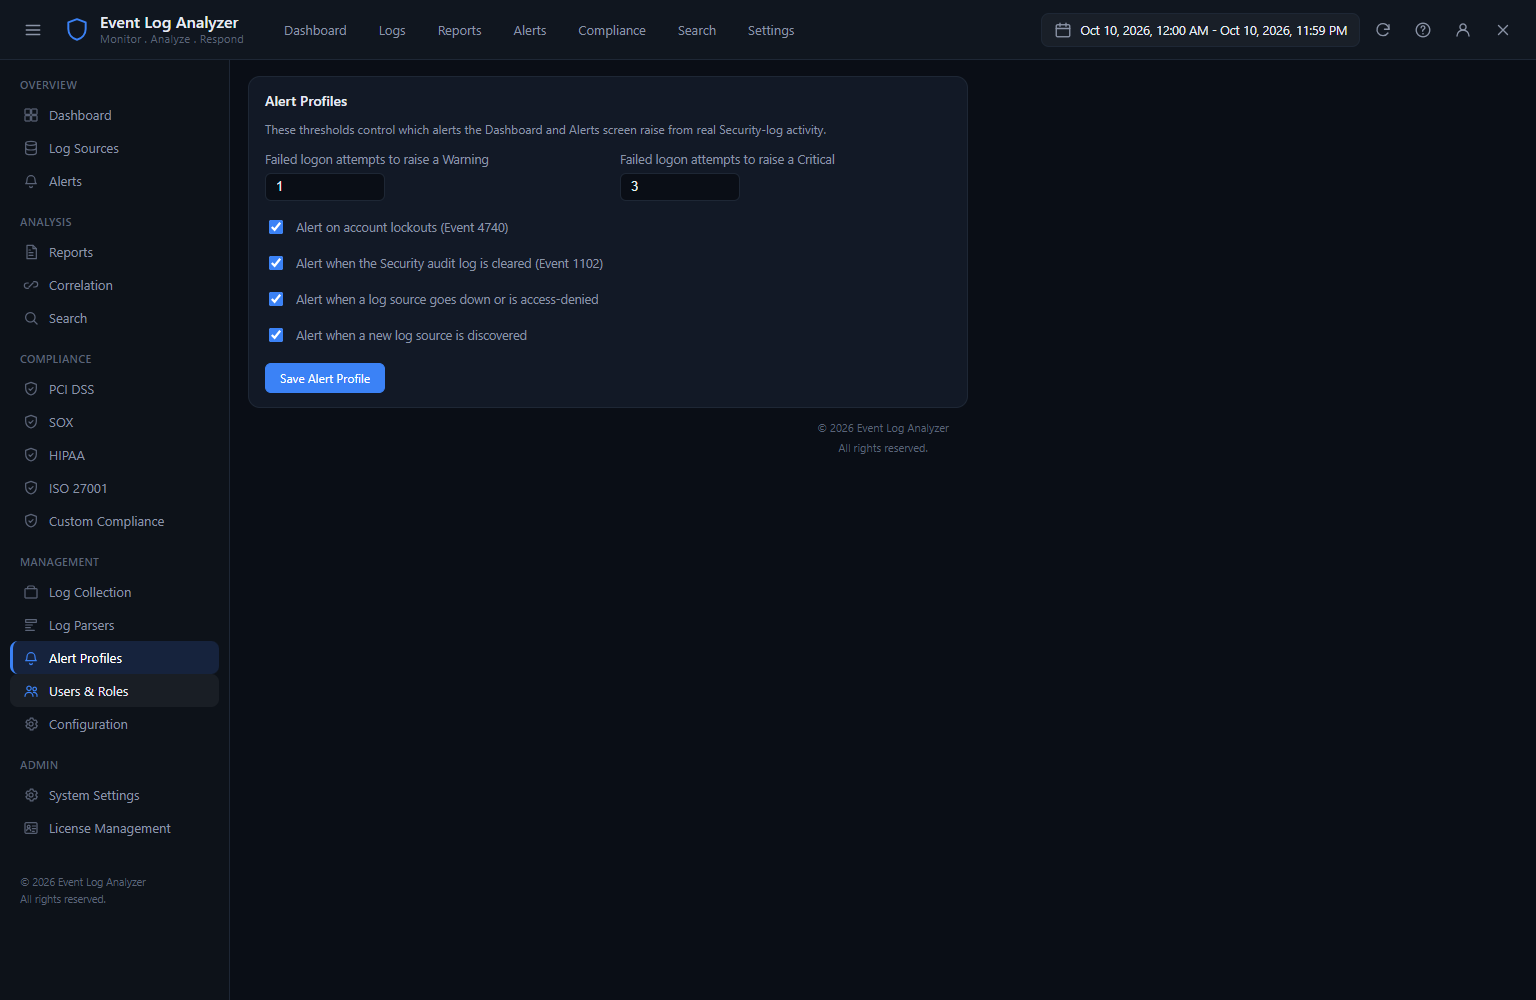
The Settings screen configures how Event Log Analyzer collects and retains event data. The collection interval determines how frequently the tool polls the Windows Event Log for new events — shorter intervals detect events faster but consume more CPU; the default (5 minutes) is appropriate for most monitoring use cases. The retention period determines how many days of event data are kept in the local database before older records are pruned. The database path can be changed to point to a larger drive for environments with high event volumes or long retention requirements. Notification preferences control whether alert triggers produce toast notifications or are silently logged.
Audit Activity — User and Account Activity Log
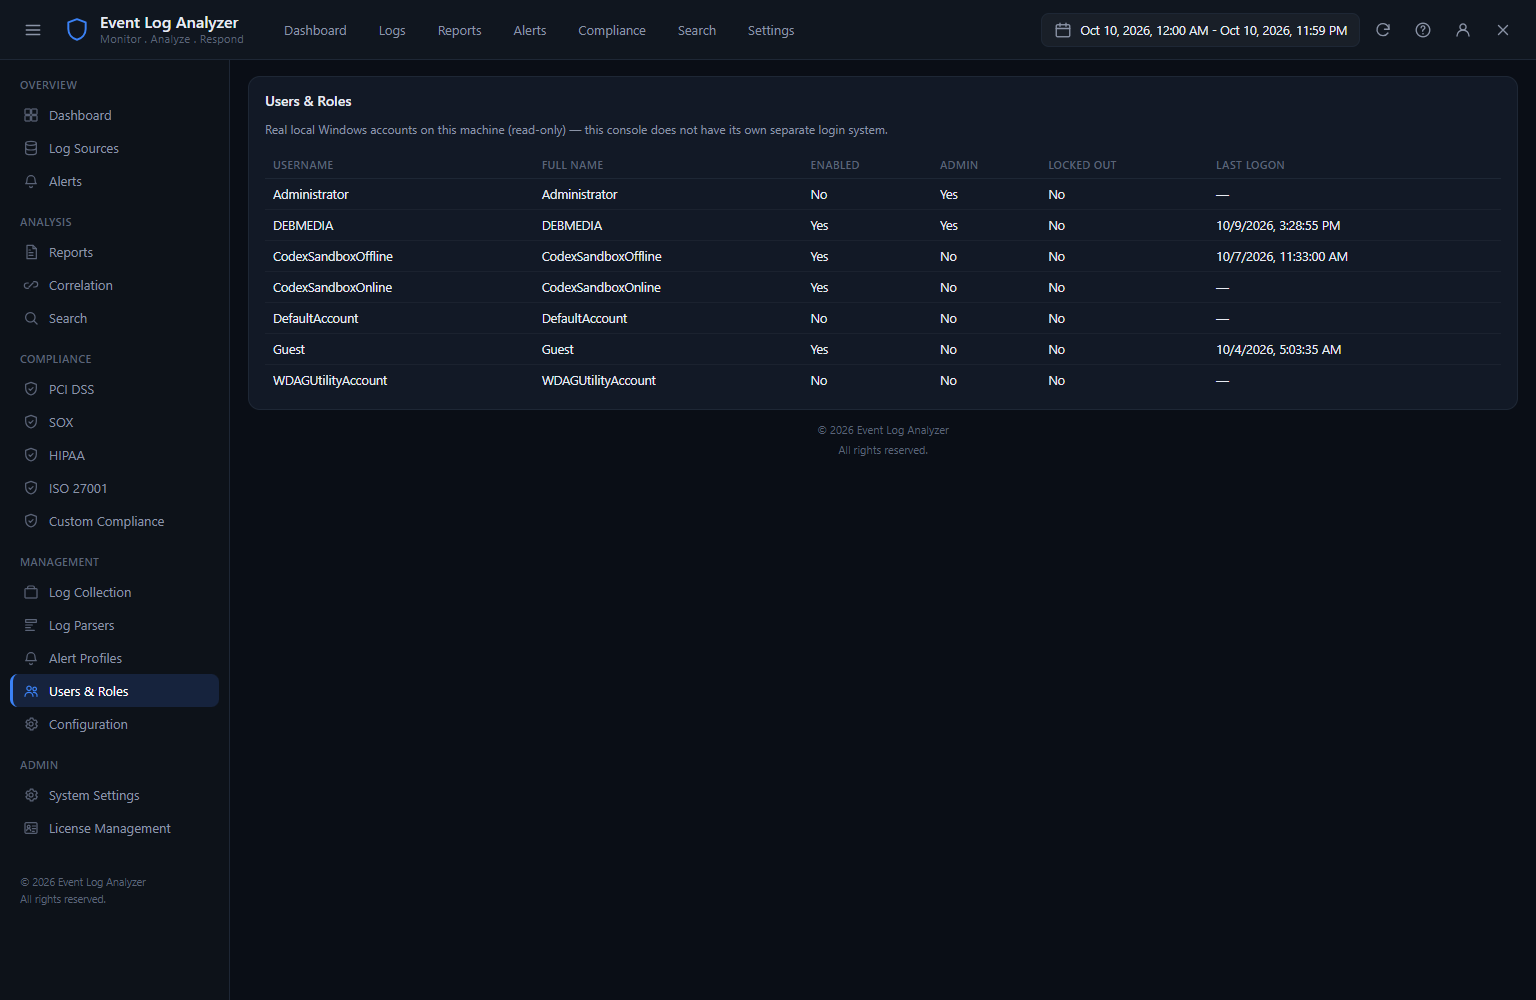
The Audit Activity view provides a dedicated view of user account-related events pulled from the Security channel — logon events (both success and failure), privilege use, account management operations (account creation, modification, deletion and group membership changes) and policy changes. This activity log is the foundation of a user activity audit trail, showing when each account logged in, from where, what elevated operations they performed and any changes made to account configuration. Exporting this view for a specific user account and time range produces the account activity report format required by most audit and incident response processes.
Event Viewer Integration — Drill-Through to Raw Windows Events
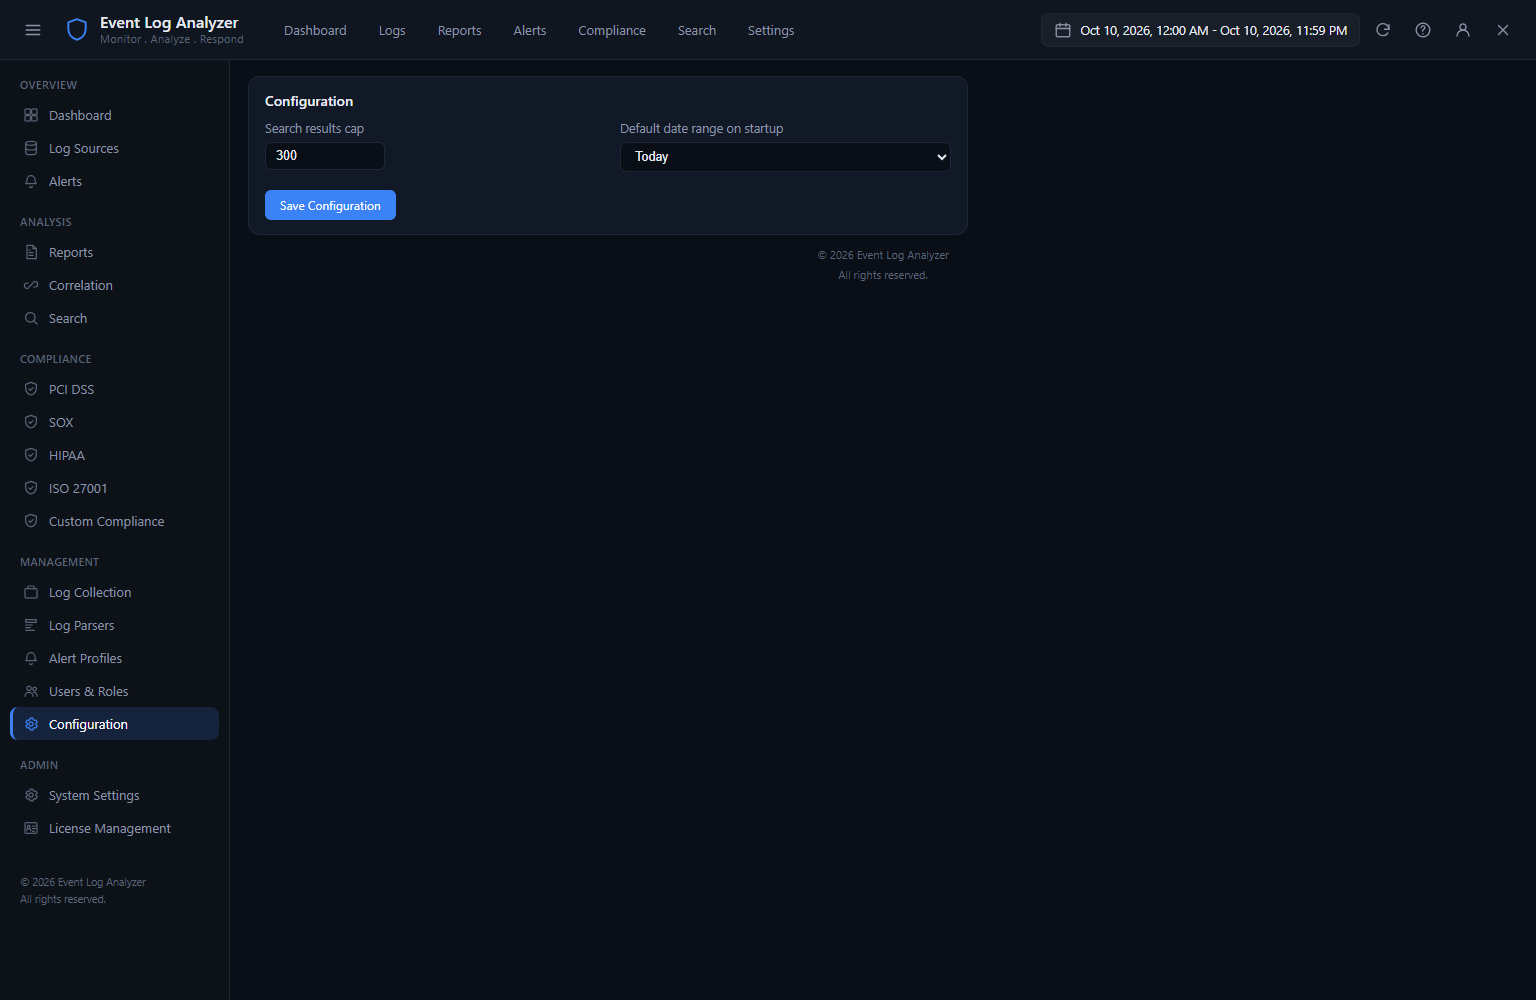
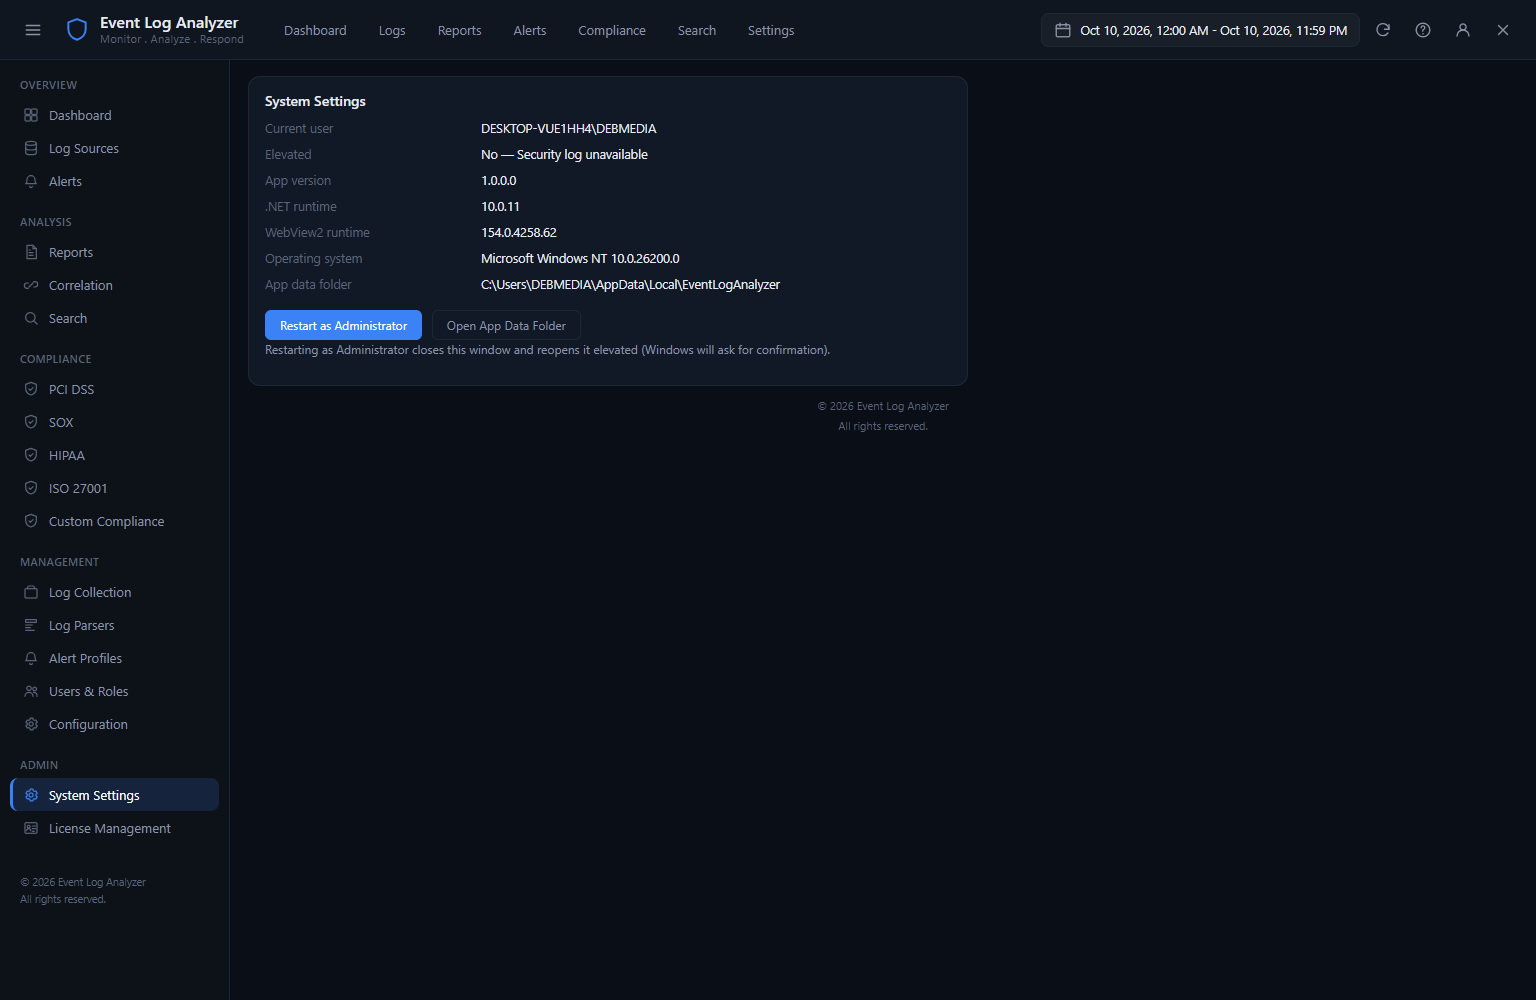
Event Log Analyzer provides its own processed and enriched views of Windows event data, but some investigation workflows benefit from accessing the raw Windows Event Viewer alongside the analyzer’s filtered views. The integration panel allows jumping directly to a specific event in the Windows Event Viewer from within Event Log Analyzer, maintaining context between the two tools when deep-dive investigation is needed. This makes Event Log Analyzer a complement to the built-in Windows tools rather than a complete replacement, giving security analysts the best of both the enriched analytics view and the familiar raw event detail view.
Advanced Log Analysis — Pattern Detection
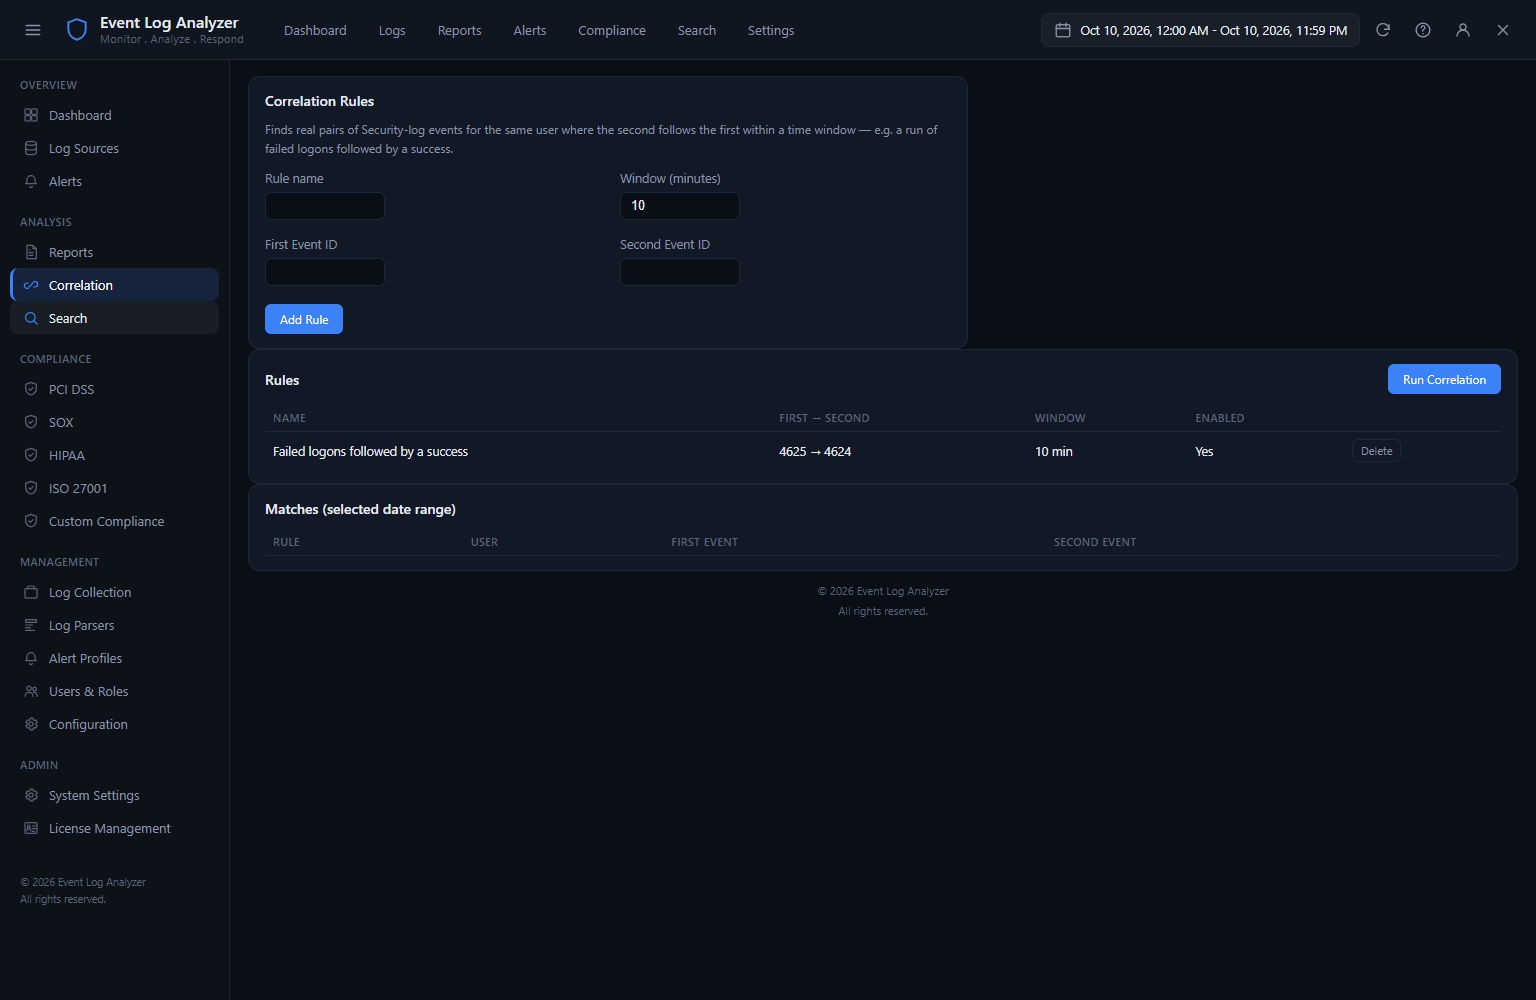
The advanced analysis view applies pattern detection across the collected event data to surface sequences of events that may indicate security incidents even when individual events appear benign. A classic pattern is: failed logon attempts (Event 4625) from one source IP followed within minutes by a successful logon (Event 4624) from the same source — which can indicate a successful brute-force attack. Pattern detection highlights these correlated event sequences automatically, presenting them in the Recent Alerts panel on the dashboard and as a dedicated finding in the analysis view for investigation.
Log Export — Full Log Data Export
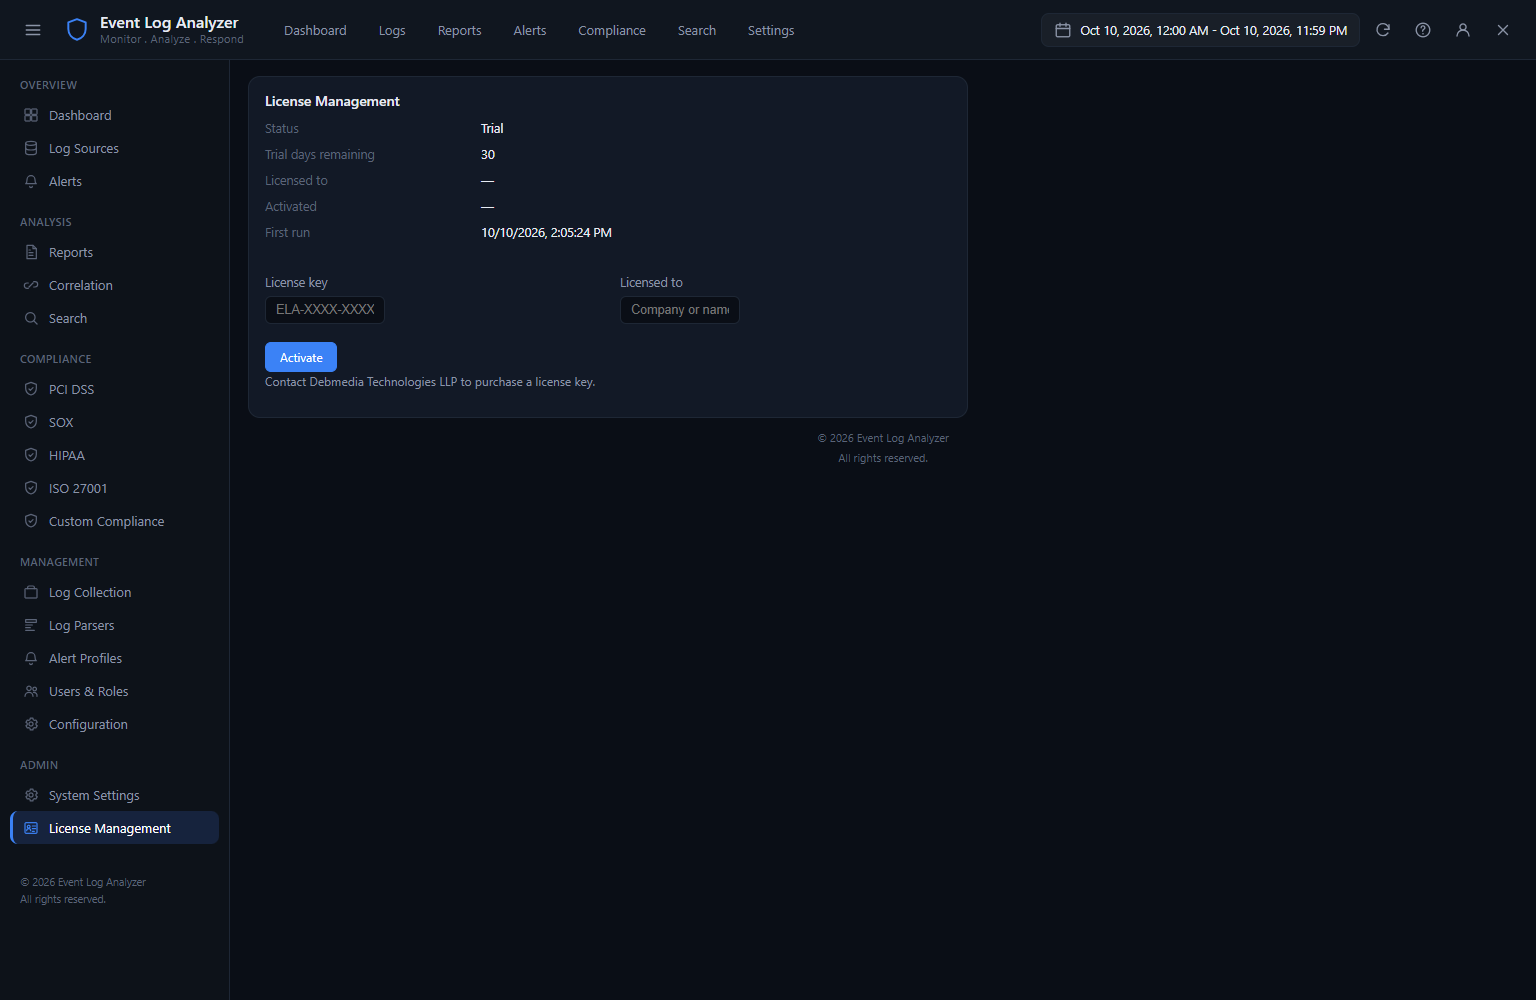
The Log Export screen allows exporting collected event data in multiple formats: CSV for spreadsheet analysis and SIEM ingestion, JSON for programmatic processing and API integration, and EVTX (the native Windows event log format) for loading into the Windows Event Viewer or another Windows monitoring tool. Export scope can be filtered by channel, time range, severity or specific event IDs, so you can export only the security events from the last 30 days without including the much larger Application and System log data, keeping exported files to a manageable size.
System Information — Environment Context
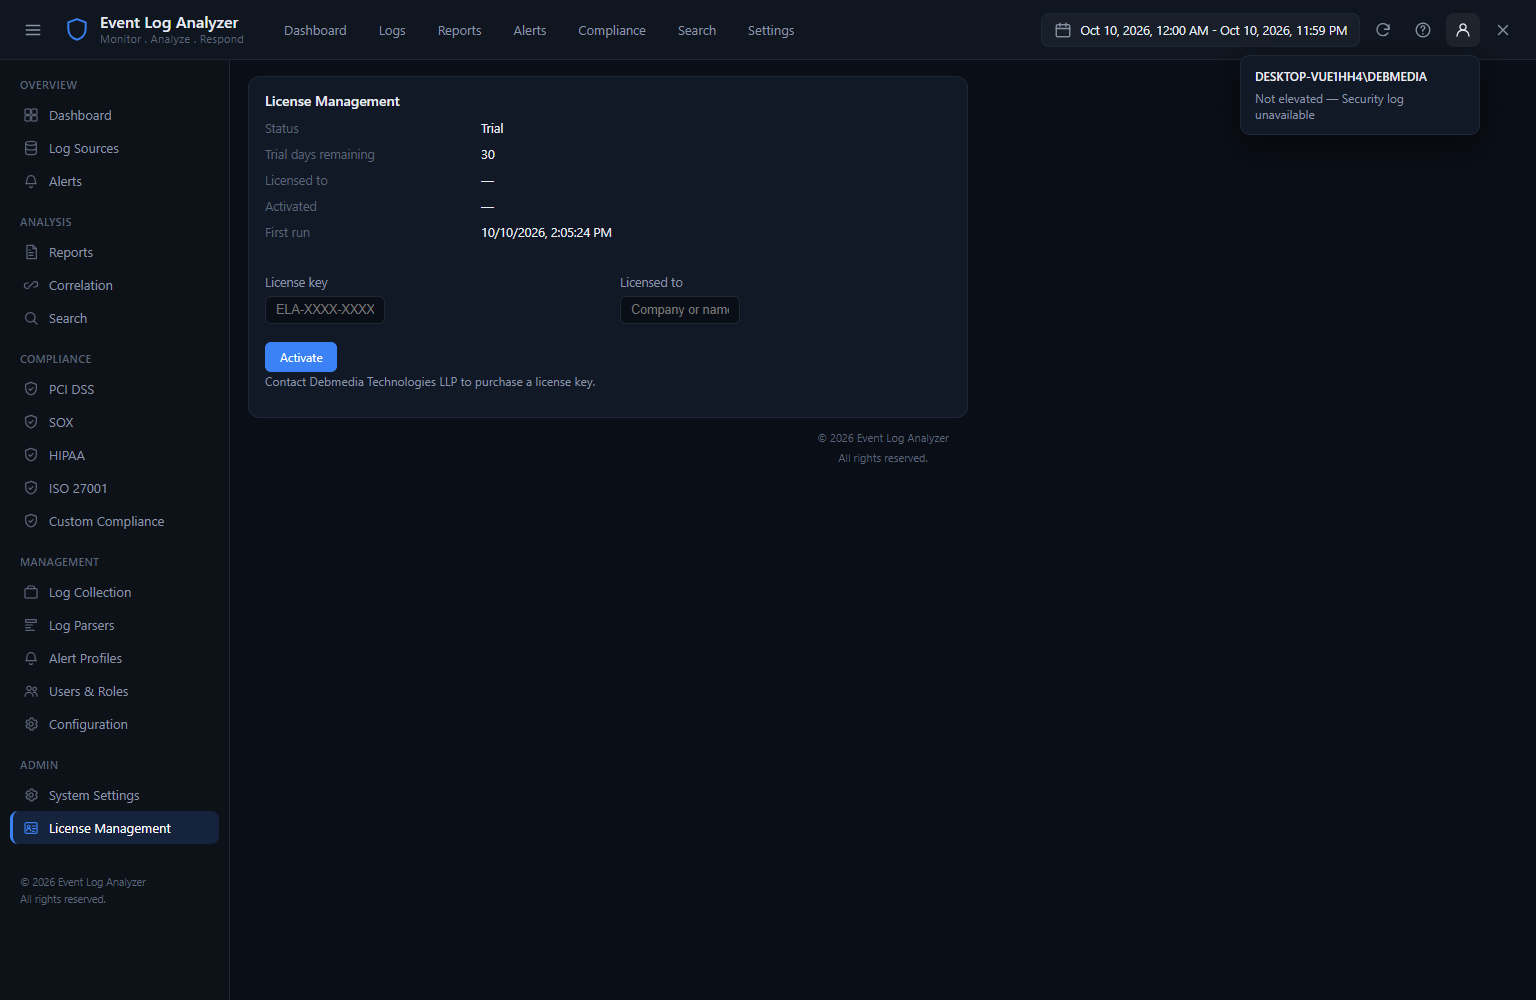
The System Information panel shows context about the environment being monitored — Windows version, whether the machine is domain-joined, the machine name and SID, and the current log collection status. This context is important for interpreting security events: a domain-joined machine generates a different set of security events than a standalone workstation, and understanding the environment is necessary for correctly evaluating compliance posture against frameworks that have different requirements for domain versus non-domain systems.
Full Dashboard — Complete Analytics View
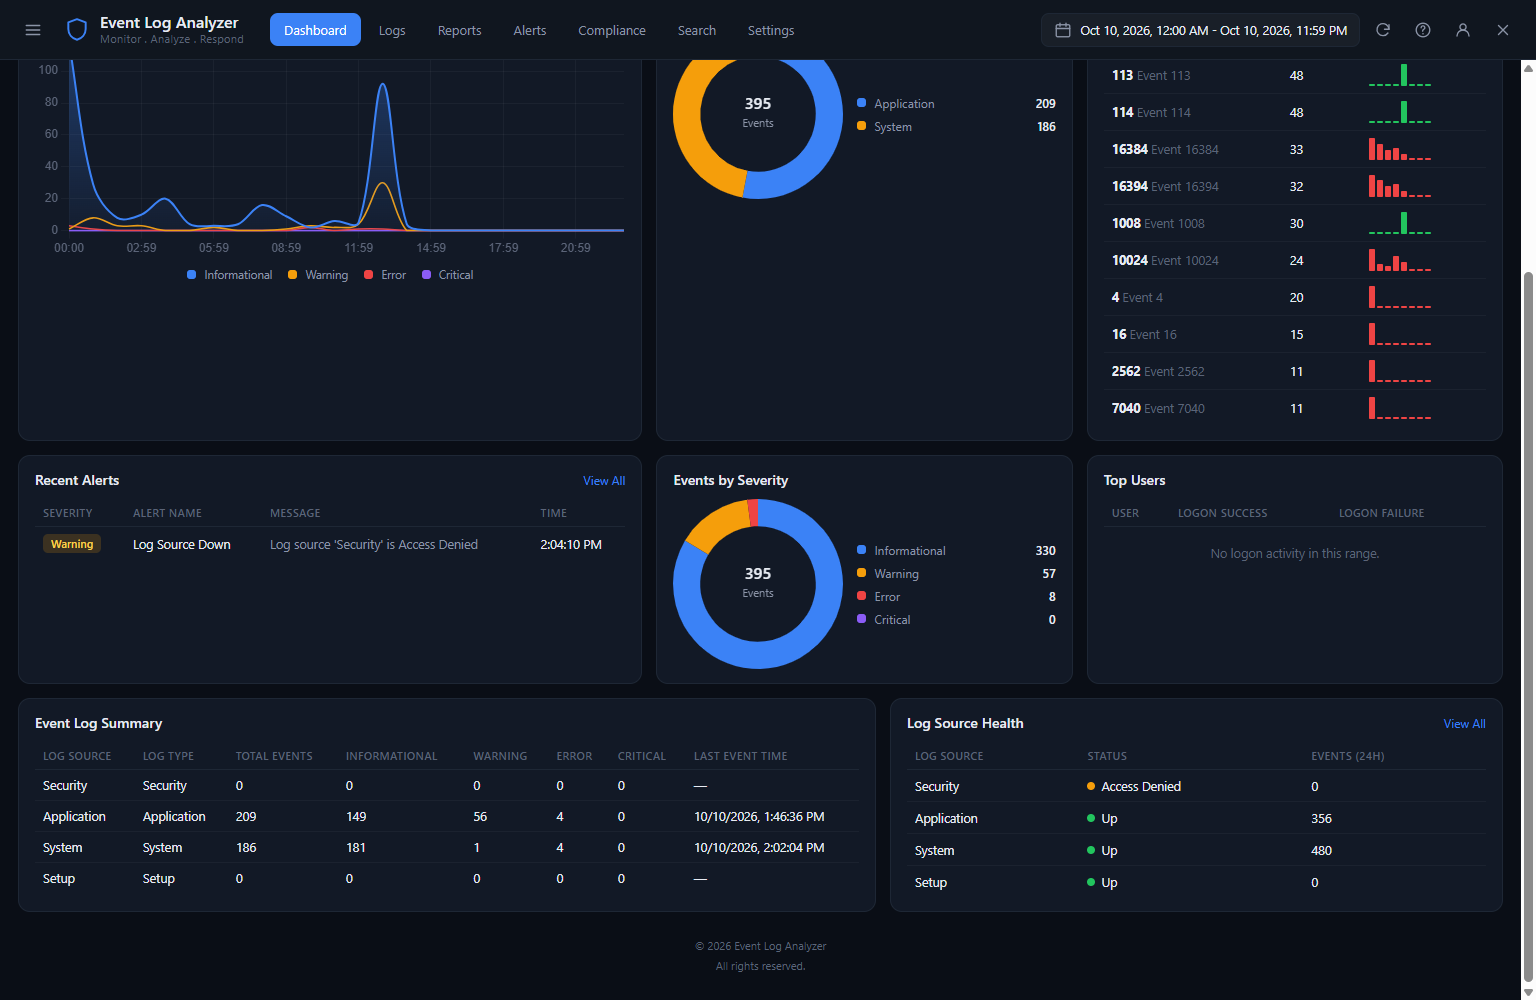
The full analytics dashboard brings together all eight data panels in their complete form — Event Trend chart, By Source donut, Top 10 Event IDs, Recent Alerts, Severity Breakdown, Top Users, Log Summary table and Log Health indicators. This is the view to return to at the start of each monitoring session: a five-second scan of this screen tells you whether the security posture of the monitored system has changed since the last review, whether any new high-severity alerts require investigation, and whether the log collection infrastructure itself is functioning correctly. It is designed to be glanceable as a monitoring dashboard and detailed enough to serve as the starting point for any investigation.
Who Is Event Log Analyzer For?
- IT security professionals and SOC analysts — Monitor Windows event logs for authentication attacks, privilege escalation, policy changes and account anomalies without the complexity and cost of a full SIEM deployment.
- System administrators — Review application and system event logs for errors, warnings and service failures, and set up alerts for critical service outages and security events that require immediate attention.
- Compliance officers and IT auditors — Generate PCI DSS and other regulatory framework compliance reports from Windows event log data, providing documented evidence of audit logging activity for assessments and audits.
- Incident responders — Rapidly search and filter event log data to reconstruct the sequence of events before, during and after a security incident, with pattern detection to surface correlated event sequences automatically.
- Small and medium businesses without SIEM — Get professional-level Windows event log monitoring and compliance reporting on a single machine without the cost and complexity of a full security information management platform.
System Requirements
- Operating System: Windows 10 (64-bit) or Windows 11; Windows Server 2016/2019/2022 supported
- Processor: Intel Core i3 or AMD Ryzen 3 equivalent or better
- RAM: 4 GB minimum — 8 GB recommended for large log volumes
- Storage: 200 MB for the application; 1–10 GB additional for the event log database depending on retention period and event volume
- Privileges: Administrator rights required for accessing the Security event log
- Runtime: .NET Desktop Runtime 6.0 or later (included in the installer)
- Internet: Not required — fully offline operation
Frequently Asked Questions
Does Event Log Analyzer send log data to a cloud service?
No. Event Log Analyzer is a fully offline, local application. All event log data is read from Windows Event Log and stored in a local SQLite database on the monitored machine. No log data, analytics results or reports are transmitted to any external server. This makes it appropriate for environments with strict data residency requirements where sending log data to a cloud SIEM would not be permitted.
Can it monitor event logs from remote machines?
The current version monitors the local machine’s Windows event channels. Support for reading event logs from remote machines over the network is planned for a future version. In environments where centralized log monitoring is required, Windows Event Forwarding can be configured to forward events from remote machines to a central collector machine running Event Log Analyzer.
How far back does it collect events?
Event Log Analyzer collects all events currently in the Windows Event Log, which Windows maintains up to its configured maximum log size. The Security log on a typical system retains between 7 and 30 days of events depending on activity volume and the log size setting in Local Security Policy. Events older than what Windows retains are not accessible unless previously archived — which is why continuous collection and the configurable retention database in Event Log Analyzer are valuable for maintaining a longer-term record.
Which compliance frameworks are supported?
The current version includes compliance report mappings for PCI DSS (Requirement 10), with additional frameworks including HIPAA, ISO 27001 and NIST SP 800-53 covered in the compliance section. The reports map specific Windows event IDs to each framework’s logging and audit trail requirements, providing evidence documentation rather than a complete compliance assessment.
Professional Windows Event Log Intelligence — Offline, Local, Comprehensive
Event Log Analyzer turns the Windows Event Log from an intimidating wall of raw data into a navigable, actionable security and operational intelligence resource. The analytics dashboard surfaces anomalies. The compliance reports generate audit evidence. The pattern detection highlights correlated security events. The alert system notifies you of critical events in real time. All of it runs offline, on your own machine, with no subscription fee and no log data leaving your environment. For IT professionals who need professional-level Windows event log analysis without the cost and complexity of a SIEM, Event Log Analyzer is the purpose-built tool that fills that gap.
Download Event Log Analyzer today — install, open the dashboard, and within minutes you will see your Windows security events in a way the built-in Event Viewer has never shown them before.
Download Event Log Analyzer
Search, filter and analyze Windows Event Logs — fast and offline