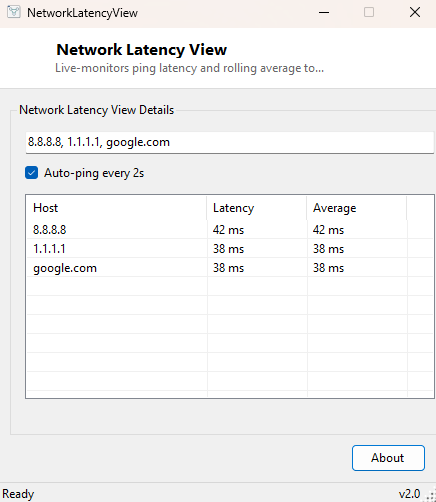
Overview
Network Latency View watches multiple hosts at once, continuously, and tracks a rolling average latency for each one rather than showing you a single ping's round-trip time in isolation. A single ping reply time is noisy and can mislead you — one slow reply among a hundred fast ones does not necessarily mean anything is wrong, while a steady upward drift across many replies usually does. This tool is built specifically to make that kind of trend visible, across several hosts side by side, without you having to run separate ping windows for each one.
Key Features
- Monitors multiple hosts simultaneously from a single comma-separated list
- Shows the most recent reply time alongside a rolling average for each host
- Auto-refreshes on a timer (default every 2 seconds) with a toggle to pause it
- Averages the last 20 replies per host to smooth out single-ping noise
- Reports timeouts and unreachable hosts clearly rather than silently skipping them
- Add or remove hosts from the list at any time and the monitor rebuilds automatically
Why You Might Need This Tool
Anyone diagnosing an intermittent connectivity problem knows the frustration of a single ping test that happens to catch the network on a good moment. Watching several reference points at once — your router, your ISP's gateway, and a well-known public DNS server like 8.8.8.8 or 1.1.1.1, for example — makes it much easier to tell whether a latency spike is local to your home network, somewhere in your ISP's path, or out on the wider internet, simply by seeing which of the monitored hosts show the problem and which stay stable. Gamers and anyone on a video call also use this kind of continuous multi-host view to confirm whether a lag spike correlates with genuine network trouble or was a one-off blip that has already resolved itself.
How It Works
On each timer tick, the tool sends one asynchronous ICMP ping to every host currently
in its list using .NET's Ping.SendPingAsync, with a per-host timeout of
1.5 seconds so one unreachable host cannot stall the others. Each successful reply's
round-trip time is appended to that host's own history list, capped at the most recent
20 samples, and the displayed "Average" column is simply the arithmetic mean of that
rolling window — recalculated fresh after every successful reply, so the average
naturally drifts to reflect current conditions rather than being permanently skewed by
a spike from several minutes ago.
How to Use It
Edit the host list textbox to a comma-separated set of hostnames or IP addresses (a sensible default list is provided on first launch), leave "Auto-ping" checked, and watch the table update automatically. Uncheck auto-ping if you want to freeze the current readings for a screenshot or closer inspection without new pings overwriting them.
System Requirements & Notes
Runs on 64-bit Windows 10 and Windows 11 with no administrator rights required, and needs an active network connection to produce meaningful results. Some hosts and corporate firewalls block ICMP entirely, which will show as a persistent timeout even though the host may be perfectly reachable over other protocols.
Frequently Asked Questions
Can I change how many hosts it monitors at once?
Yes — the host list is a plain comma-separated textbox, so you can monitor as many or
as few hosts as you like, limited only by how much network traffic you want to
generate every refresh cycle.
Why does one host show consistently higher latency than the others?
That is usually simply distance and network topology — a host on the far side of the
world will always show higher baseline latency than your own router, regardless of
whether anything is actually wrong.