
EDU
Home  /  Curated Curriculum
Learning Path Library

CuratedCurriculum

Opinionated, week-by-week learning paths distilled from two decades of building production SaaS — exactly what to learn, in what order, and why. No filler.

260
Learning Paths
16
Tracks
79
Expert Level
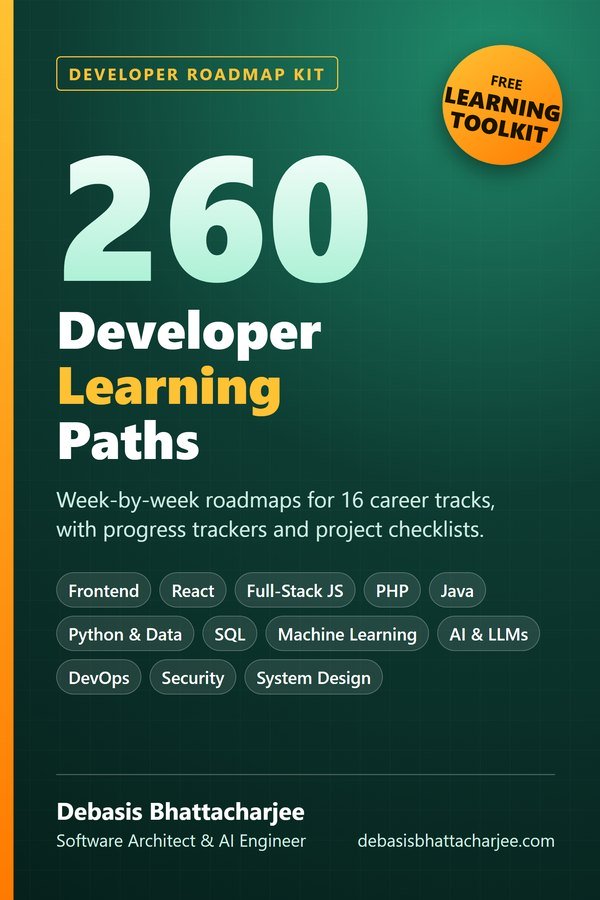
260 Developer Learning Paths PDF cover
Developer Roadmap Kit · PDF

260 Developer Learning Paths, in one PDF

  • Week-by-week roadmaps for 16 career tracks, from Beginner to Expert
  • A progress tracker on every path, so you can see how far you have come
  • Free Learning Toolkit: 6-week schedule, weekly review sheet, project checklist, CV tips
$4.99 one-time · instant email delivery
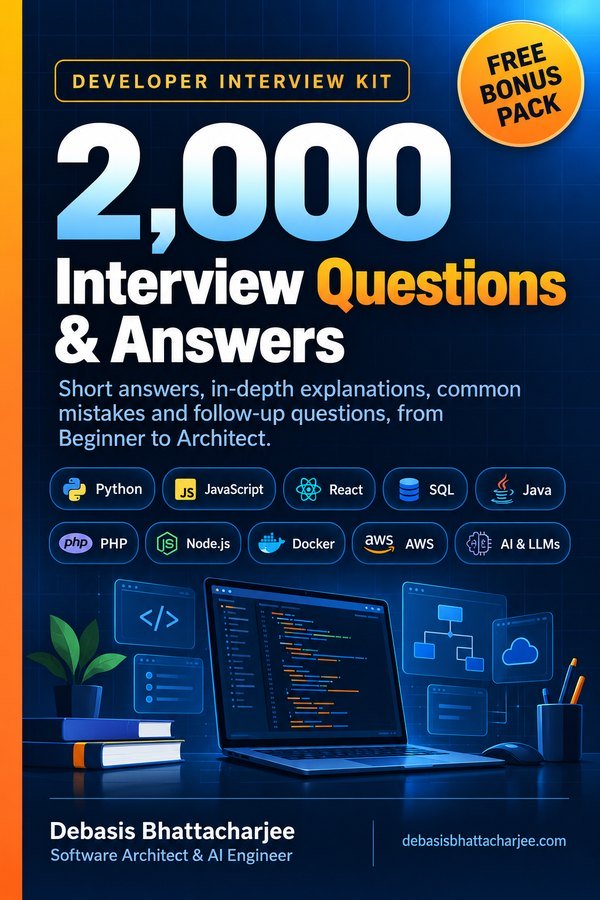
2,000 Interview Questions & Answers cover
Also available: 2,000 Interview Questions & Answers $7.99 The questions developers get asked in interviews, across 89 topics, with short answers, in-depth explanations, common mistakes and follow-ups. See what's inside →

Get both books for $9.99 (save $2.99):

The material stays free to read online. This is the organised, offline, print-ready PDF edition. Secure payment by PayPal; your personal download link is emailed after payment is confirmed. Digital product, no shipping.

✕ Clear

Showing 29 learning paths · Python for Data Analysis

Clear filters
CUR-2026-370 Python for Data Analysis ◑ Intermediate 6 weeks 4 min read · 2026-06-10

If You Want to Master Python for Data Analysis, Skip the Fluff and Focus on Real-World Skills.

Many learners drown in theory and scattered tutorials, leaving them unable to apply Python effectively. This path zeroes in on practical experience…

python data-analysis pandas scipy
▾
Why Most People Learn This Wrong

At the intermediate level, many learners get trapped in a cycle of consuming endless tutorials and documentation without applying what they've learned. They believe that watching hour-long videos or reading about libraries like NumPy and Pandas will magically make them proficient. This surface-level engagement leads to a shallow understanding of how to integrate these libraries into real-world scenarios.

The issue is compounded by the overwhelming amount of available resources, which can lead to confusion and paralysis by analysis. Instead of building projects or diving into meaningful analysis, they find themselves stuck in the loop of passive learning. This path is designed to break that cycle.

By focusing on practical application and real data sets from the get-go, you'll not only become familiar with the tools but also learn how to use them effectively. You'll tackle core libraries, analytics techniques, and visualization tools that matter in the industry.

Ultimately, this path emphasizes actionable learning, ensuring that by the end, you can confidently analyze data and present your findings. Forget lore and theory; it's time to get your hands dirty.

What You Will Be Able to Do After This Path
  • Analyze datasets using Pandas for data manipulation.
  • Create compelling visualizations with Matplotlib and Seaborn.
  • Implement statistical analyses using Scipy.
  • Clean and preprocess data effectively, making it ready for analysis.
  • Utilize Jupyter Notebooks for interactive data exploration and presentation.
  • Conduct exploratory data analysis (EDA) to derive insights from real data.
The Week-by-Week Syllabus 6 weeks

This syllabus is designed to progressively build your skills with hands-on projects and applications of Python in data analysis.

What to learn: Core concepts of Pandas for data structures (Series, DataFrame), data loading, and manipulation.

Why this comes before the next step: Understanding the data frame is crucial for performing any analysis and sets the foundation for using other libraries.

Mini-project/Exercise: Load a CSV file containing sales data and perform basic operations like filtering and aggregating.

What to learn: Techniques for data cleaning, handling missing values, and data type conversions using Pandas.

Why this comes before the next step: Clean data is essential for accurate analysis; this week ensures that your datasets are ready for exploration.

Mini-project/Exercise: Clean a messy dataset from a public repository and prepare it for analysis.

What to learn: Conduct EDA using Pandas and visualization libraries like Matplotlib and Seaborn.

Why this comes before the next step: EDA helps you understand patterns and insights that inform your analysis; it's a bridge to deeper statistical methods.

Mini-project/Exercise: Analyze a dataset and create visualizations to illustrate your findings.

What to learn: Basic statistical concepts and how to apply them using the Scipy library.

Why this comes before the next step: Understanding statistics is vital for data analysis; it helps validate your findings and inform decisions.

Mini-project/Exercise: Perform a hypothesis test on a dataset and interpret the results.

What to learn: Advanced visualization techniques and best practices using Matplotlib and Seaborn.

Why this comes before the next step: Good visualization helps communicate your findings effectively, which is key when presenting results.

Mini-project/Exercise: Create a comprehensive dashboard or report with various visual elements to summarize your analysis.

What to learn: Integrate all learned skills into a cohesive data analysis project.

Why this comes before the next step: This final project consolidates your learning and demonstrates your ability to analyze data independently.

Mini-project/Exercise: Choose a dataset, conduct a thorough analysis, and present findings with visualizations and insights in a Jupyter Notebook.

The Skill Tree — Learn in This Order
  1. Basic Python Programming
  2. Introduction to Data Analysis
  3. Data Manipulation with Pandas
  4. Data Cleaning Techniques
  5. Exploratory Data Analysis
  6. Statistical Analysis with Scipy
  7. Data Visualization with Matplotlib and Seaborn
  8. Capstone Project Integration
Curated Resources — No Filler

These handpicked resources will support your learning journey effectively.

Resource Why It's Good Where To Use It
Pandas Documentation Official docs are thorough and provide practical examples. Reference while learning data manipulation.
Python Data Science Handbook by Jake VanderPlas A comprehensive resource covering essential data science libraries. Use for deeper insights into data manipulation and analysis.
Kaggle Datasets A large repository of real-world datasets for practice. Find datasets for projects and exercises.
DataCamp Courses Interactive courses on data science concepts and tools. Supplement your learning with practical exercises.
Towards Data Science Articles Community-driven articles providing insights and tips. Learn advanced techniques and industry trends.
Common Traps & How to Avoid Them

Why it happens: Many learners depend too heavily on libraries without understanding the underlying principles, leading to poor implementations.

Correction: Take the time to understand how libraries work and the fundamental concepts behind data manipulation and analysis.

Why it happens: It's easy to practice with sanitized datasets, but they often don't represent real-world challenges.

Correction: Always seek out messy, real datasets for practice to build your problem-solving skills.

Why it happens: Learners often skip over documentation, thinking they can figure things out on their own.

Correction: Make it a habit to consult documentation; it's a valuable resource that can clarify confusion and deepen understanding.

What Comes Next

After completing this path, you should explore advanced topics like machine learning with scikit-learn or delve into cloud platforms for data storage and processing. Consider specializing in data science or data engineering, or start building your portfolio with real-world projects. The world of data is vast, and there's always more to learn and apply.

Open Full Learning Path ↗
CUR-2026-221 Python for Data Analysis ○ Beginner 6 weeks 4 min read · 2026-06-02

Master Python for Data Analysis in 2024: The No-Nonsense Roadmap

While most learners flounder with superficial tutorials, this path dives deep into practical skills that actually matter in data analysis. Stop wasting…

python pandas data-analysis matplotlib
▾
Why Most People Learn This Wrong

Many beginners believe that simply reading Python books or watching endless video tutorials will magically transform them into data analysts. This 'learn by watching' approach creates a false sense of confidence but leaves a shallow understanding of how to apply Python in real-world scenarios.

What often happens is that learners get stuck on syntax and forget the core principles of data manipulation and analysis. They can recite methods but can't execute a data-driven project successfully. This learning path seeks to flip that narrative completely.

Instead of passively absorbing information, this structured path emphasizes hands-on projects, encouraging you to engage with the data and the tools you will actually use in the industry. You will not just learn to code; you will learn to think like a data analyst.

What You Will Be Able to Do After This Path
  • Use Python to clean, analyze, and visualize datasets.
  • Manipulate data using Pandas for effective data wrangling.
  • Create visualizations using Matplotlib and Seaborn.
  • Perform exploratory data analysis (EDA) to extract insights from data.
  • Work with various data formats such as CSV, JSON, and Excel.
  • Implement basic statistical analyses using NumPy.
  • Build a small data-driven project to showcase your skills.
The Week-by-Week Syllabus 6 weeks

This syllabus is designed to take you from zero to data analysis hero in six weeks. You'll build foundational skills and complete mini-projects that solidify your understanding.

What to learn: Basic Python syntax, data types, and control structures.

Why this comes before the next step: Understanding Python fundamentals is crucial for manipulating data effectively.

Mini-project/Exercise: Build a simple Python script that takes user input and performs basic calculations.

What to learn: Dataframe creation, filtering, and basic aggregation with Pandas.

Why this comes before the next step: Pandas is the backbone of data manipulation in Python; mastering it is essential for any analysis.

Mini-project/Exercise: Load a CSV file and perform basic data cleaning and aggregation.

What to learn: Plotting with Matplotlib and Seaborn.

Why this comes before the next step: Visualizing data helps in understanding trends and patterns, which is key to analysis.

Mini-project/Exercise: Create visualizations based on the data cleaned from the previous week.

What to learn: Techniques for EDA including summary statistics and correlation analysis.

Why this comes before the next step: EDA is crucial to uncovering insights that inform decision-making.

Mini-project/Exercise: Analyze a dataset of your choice and write a report summarizing your findings.

What to learn: Data extraction from CSV, JSON, and Excel files.

Why this comes before the next step: Data often comes in various formats; knowing how to handle them expands your capabilities.

Mini-project/Exercise: Create a script that combines data from multiple formats into a single Pandas dataframe.

What to learn: Integrate all skills learned to complete a data analysis project.

Why this comes before the next step: This is your chance to apply everything you've learned in a comprehensive way.

Mini-project/Exercise: Undertake a data analysis project that includes data collection, manipulation, visualization, and a final report.

The Skill Tree — Learn in This Order
  1. Python Basics
  2. Data Structures and Control Flow
  3. Introduction to Pandas
  4. Data Cleaning Techniques
  5. Data Visualization Fundamentals
  6. Exploratory Data Analysis
  7. Handling Data Formats
  8. Capstone Data Analysis Project
Curated Resources — No Filler

These resources will help you deepen your understanding and offer practical exercises.

Resource Why It's Good Where To Use It
Python.org Documentation Official docs are comprehensive and regularly updated. Reference for syntax and libraries.
"Python for Data Analysis" by Wes McKinney The go-to book for learning practical data analysis with Pandas. Deep dive into Pandas and data manipulation.
Kaggle Datasets Real-world datasets to practice your skills. Hands-on projects and competition.
Codecademy Python Course Interactive tutorials that solidify basic Python knowledge. Initial learning phase.
DataCamp's Pandas Course Focused, hands-on learning specifically for data analysis. Practice after mastering the basics.
Common Traps & How to Avoid Them

Why it happens: Learners often feel overwhelmed and think they can just absorb theory. They end up with book smarts but no practical skills.

Correction: Commit to hands-on projects every week. Your learning will stick when you apply it.

Why it happens: Beginners might try to implement complex solutions for simple problems, leading to frustration.

Correction: Start with the simplest solution then iterate for complexity. Use Python’s straightforwardness to your advantage.

Why it happens: Newcomers might underestimate the importance of cleaning data, leading to inaccurate analyses.

Correction: Emphasize data cleaning in your projects; it's often more crucial than the analysis itself.

What Comes Next

Once you've completed this path, consider diving deeper into machine learning with Python. Tools like Scikit-learn and TensorFlow can take your data skills to the next level. Alternatively, work on larger real-world projects or consider contributing to open-source data analysis projects to gain valuable experience.

Open Full Learning Path ↗
CUR-2026-455 Python for Data Analysis ● Advanced 6 weeks 4 min read · 2026-05-30

If You Want to Master Python for Data Analysis, Ditch the Surface-Level Libraries and Dive Deep into Advanced Techniques.

Most learners get stuck using libraries like Pandas and NumPy superficially, missing the advanced techniques that drive real insights. This path demands…

python pandas statsmodels scikit-learn
▾
Why Most People Learn This Wrong

Many advanced learners mistake familiarity with popular libraries like Pandas and NumPy as mastery. They often use these tools without understanding the underlying principles of data manipulation and analysis. This shallow approach leads to mediocre results, where users only scratch the surface of what these libraries can do.

Another common pitfall is relying on automated solutions or high-level abstractions found in frameworks like Dask without grasping the fundamental operations that make data analysis powerful. While these tools can handle big data, they do not replace the need for a solid understanding of data structures, algorithms, and statistical methods.

This path is designed to correct these misconceptions by emphasizing a deep dive into advanced techniques such as time series analysis with Statsmodels, interactive visualizations with Plotly, and machine learning with Scikit-Learn. Mastery comes from understanding how to apply these tools comprehensively, rather than merely knowing how to use them.

Throughout this journey, you will engage in challenging projects that solidify your knowledge and prepare you for real-world analytical problems, elevating your skills beyond just 'knowing Python.' You’ll come away with a toolkit ready for serious data challenges.

What You Will Be Able to Do After This Path
  • Perform advanced data manipulations using Pandas and PySpark.
  • Implement robust statistical models with Statsmodels.
  • Create dynamic dashboards and visualizations using Plotly and Dash.
  • Use Scikit-Learn for deploying machine learning algorithms.
  • Conduct time series analysis and forecasting.
  • Optimize data processing workflows for large datasets.
  • Engage in exploratory data analysis using advanced techniques.
  • Implement data cleaning and transformation strategies effectively.
The Week-by-Week Syllabus 6 weeks

This syllabus is structured to build your advanced Python for data analysis skills progressively, enabling you to tackle increasingly complex projects.

What to learn: Focus on advanced features of Pandas, including multi-indexing, pivot tables, and performance optimization.

Why this comes before the next step: Mastering data manipulation is crucial as it forms the foundation for any analysis you will undertake.

Mini-project/Exercise: Create a comprehensive data cleaning pipeline for a messy dataset, utilizing all advanced Pandas functionalities.

What to learn: Dive into Statsmodels for time series analysis, including Autoregressive Integrated Moving Average (ARIMA) and seasonal decomposition.

Why this comes before the next step: Time series analysis is critical for understanding trends and patterns in data over time.

Mini-project/Exercise: Analyze historical stock price data to predict future trends using ARIMA models.

What to learn: Learn to create interactive visualizations and dashboards using Plotly and Dash.

Why this comes before the next step: Effective data visualization enhances communication of insights derived from analysis.

Mini-project/Exercise: Build an interactive dashboard that displays key metrics from your previous time series analysis.

What to learn: Grasp the fundamentals of machine learning using Scikit-Learn, including data preprocessing, model selection, and evaluation.

Why this comes before the next step: Understanding machine learning principles is essential for predictive analytics.

Mini-project/Exercise: Create a predictive model to classify customer data based on purchasing behavior.

What to learn: Explore ensemble methods, hyperparameter tuning, and model evaluation techniques in Scikit-Learn.

Why this comes before the next step: Advanced techniques are necessary to improve model performance and accuracy.

Mini-project/Exercise: Implement and evaluate various models on a dataset and compare their performance metrics.

What to learn: Learn how to use PySpark for handling big data, focusing on DataFrames and distributed computing.

Why this comes before the next step: Handling large datasets efficiently is a critical skill in data analysis.

Mini-project/Exercise: Process a large dataset using PySpark to generate insights and visualizations.

The Skill Tree — Learn in This Order
  1. Advanced Python programming concepts
  2. Pandas for data manipulation
  3. Statsmodels for statistical analysis
  4. Plotly for data visualization
  5. Scikit-Learn for machine learning fundamentals
  6. Advanced techniques in Scikit-Learn
  7. PySpark for big data processing
Curated Resources — No Filler

These resources will help you deepen your knowledge in data analysis with Python efficiently.

Resource Why It's Good Where To Use It
Pandas Documentation Comprehensive and detailed, ideal for advanced functionalities. Throughout the entire path
Statsmodels Documentation In-depth resources for time series analysis techniques. During Week 2
Plotly Official Guide Offers tutorials for creating engaging visualizations. Week 3 project
Scikit-Learn User Guide Essential for understanding machine learning algorithms. Weeks 4 and 5
PySpark Documentation Key for learning efficient big data processing. Week 6
Hands-On Data Analysis with Python (Book) Great resource for practical applications and case studies. Supplementary reading
Common Traps & How to Avoid Them

Why it happens: Many learners become overly dependent on libraries without understanding the mathematical foundations behind them.

Correction: Spend time understanding the theory behind the algorithms used in these libraries. Consider implementing algorithms from scratch to solidify your knowledge.

Why it happens: Learners often neglect data cleaning, assuming libraries handle it automatically.

Correction: Emphasize data cleaning and preprocessing as a critical step in your analysis workflow.

Why it happens: There's often a rush to apply machine learning techniques without grasping the relevant statistical principles.

Correction: Ensure you cover the statistical theory for each model you apply, so you understand what your results mean.

What Comes Next

After completing this path, consider diving deeper into machine learning specialization or exploring data engineering principles. Specializing in NLP or computer vision can also provide you with a significant edge in the job market.

Additionally, engaging in real-world projects or contributing to open-source data analysis initiatives will ensure you continue building an impressive portfolio.

Open Full Learning Path ↗
CUR-2026-213 Python for Data Analysis ● Advanced 6 weeks 5 min read · 2026-05-20

If You Want to Master Python for Data Analysis, Stop Just Googling and Start Deep Diving.

Too many advanced learners skim the surface with libraries without grasping the underlying principles. This path demands you dive deep into the…

python data-analysis pandas numpy
▾
Why Most People Learn This Wrong

When it comes to advanced Python for data analysis, the most common mistake is relying heavily on libraries like Pandas and NumPy without understanding the underlying mechanics of data structures and algorithms. Many learners tend to treat these powerful tools like magic wands—hoping for results without comprehending the processes that drive them. This creates a shallow understanding that can lead to inefficiencies and errors down the line.

The reality is that advanced data analysis requires a solid grounding in both the Python programming language and the statistical methods that underpin data science. Without this, you won’t just struggle with complex tasks; you’ll also miss out on optimization opportunities. This learning path takes a different approach: it focuses on core principles, encouraging a mastery of the tools rather than a mere familiarity.

Moreover, many advanced learners skip over crucial topics such as performance optimization using libraries like Dask for parallel computing or exploring the interoperability of Python with other languages like R. These oversights can limit your capacity to handle big data efficiently. I want you to embrace the complexity and leverage it, mastering not just how to analyze data, but also how to optimize and scale your solutions.

This path is designed to force you into a deeper understanding of data analysis, demanding not just knowledge but the application of that knowledge in real-world scenarios. By the end, you’ll have a robust skill set that goes beyond surface-level proficiency to genuine expertise.

What You Will Be Able to Do After This Path
  • Implement complex data manipulation using Pandas with advanced techniques.
  • Optimize data workflows with Dask for handling large datasets.
  • Create custom data visualizations using Matplotlib and Seaborn.
  • Perform statistical analyses using libraries like Statsmodels.
  • Integrate Python with SQL databases for data extraction and transformation.
  • Leverage NumPy for advanced numerical computing and performance tuning.
  • Design and deploy machine learning models using Scikit-learn.
  • Automate data workflows with Airflow for reproducibility and scheduling.
The Week-by-Week Syllabus 6 weeks

This path is structured to build on your existing knowledge while pushing you to explore deeper concepts and practices in data analysis.

What to learn: Advanced data manipulation techniques using Pandas, including multi-indexing, pivot tables, and complex aggregations.

Why this comes before the next step: Mastery of Pandas is essential as it serves as the backbone for most data analysis tasks.

Mini-project/Exercise: Create a comprehensive data report using a large dataset, employing multiple Pandas features.

What to learn: Use NumPy for efficient numerical calculations and explore performance optimization techniques.

Why this comes before the next step: Understanding vectorized operations is crucial for optimizing data analysis workflows.

Mini-project/Exercise: Compare performance of various aggregation methods on the same dataset.

What to learn: Master data visualization libraries Matplotlib and Seaborn to create insightful visual reports.

Why this comes before the next step: Data visualization is vital for interpreting results and communicating findings.

Mini-project/Exercise: Build a comprehensive dashboard presenting key insights from your previous projects.

What to learn: Conduct statistical analyses including regression, hypothesis testing, and time-series forecasting using Statsmodels.

Why this comes before the next step: Statistical reasoning will strengthen your capacity to make data-driven decisions.

Mini-project/Exercise: Perform a regression analysis on a chosen dataset and interpret the results.

What to learn: Integrate SQL for data extraction and learn Dask for handling large datasets.

Why this comes before the next step: Efficient data sourcing and processing is key for robust analysis.

Mini-project/Exercise: Create a pipeline that extracts, transforms, and loads (ETL) data from a SQL database into a Dask DataFrame.

What to learn: Learn how to use Airflow to schedule and automate data workflows.

Why this comes before the next step: Automation improves efficiency and reproducibility in analysis workflows.

Mini-project/Exercise: Develop a simple DAG to automate your previous data processing tasks.

The Skill Tree — Learn in This Order
  1. Advanced Python Programming
  2. Pandas for Data Manipulation
  3. NumPy for Numerical Operations
  4. Data Visualization Techniques
  5. Statistical Analysis Fundamentals
  6. SQL for Data Extraction
  7. Performance Optimization with Dask
  8. Automating Workflows with Airflow
Curated Resources — No Filler

These resources will guide you through the complexities of advanced Python for data analysis.

Resource Why It's Good Where To Use It
Pandas Documentation Comprehensive guide on all Pandas features. Week 1
NumPy User Guide Detailed overview of NumPy functions and performance tips. Week 2
Data Visualization with Matplotlib and Seaborn Offers practical examples of data visualization. Week 3
Statsmodels Documentation Essential for understanding statistical modeling in Python. Week 4
Dask Documentation Focuses on parallel computing and optimization. Week 5
Airflow Documentation Great resource for understanding workflow automation. Week 6
Common Traps & How to Avoid Them

Why it happens: Learners often treat libraries as black boxes, missing the underlying concepts.

Correction: Dedicate time to learn the theory behind the libraries you use. Understand what each function is doing under the hood.

Why it happens: Advanced learners may overlook data cleaning and preprocessing, assuming datasets are ready for analysis.

Correction: Always validate and preprocess your data. Implement best practices for data cleaning.

Why it happens: Many learners believe they can skip documentation and learn through trial and error.

Correction: Make it a habit to read relevant documentation for the libraries you use; it saves time and increases understanding.

What Comes Next

After completing this path, consider delving deeper into machine learning or data engineering. Specializing in areas such as deep learning with TensorFlow or expanding your knowledge in cloud-based data solutions like AWS can be incredibly beneficial. Additionally, working on real-world projects will solidify your skills and put your learning into practice.

Engage with communities or forums focused on data science to stay updated and receive feedback on your projects. Your next step is to build a portfolio that showcases your advanced skills and attracts potential employers or collaborators.

Open Full Learning Path ↗
CUR-2026-269 Python for Data Analysis ◑ Intermediate 6 weeks 4 min read · 2026-05-15

If You Want to Level Up Your Python Data Analysis Skills, Follow This Exact Path.

Stop learning Python for data analysis by just copying code from tutorials. This path emphasizes deep understanding and practical application that many…

python pandas data-analysis machine-learning
▾
Why Most People Learn This Wrong

Many intermediate learners stumble by treating Python for data analysis as a series of scripts to run rather than a language to master. They get comfortable with libraries like Pandas or NumPy without truly understanding the underlying data structures or methodologies. This often leads to a superficial grasp of concepts, where learners can accomplish tasks but can’t explain why their code works or how to optimize it.

The typical approach also neglects the importance of data visualization and effective communication of results. Without these skills, even the most accurate analysis can fail to make an impact. This learning path, however, is structured to build a solid foundation in both technical proficiency and data storytelling.

Furthermore, intermediate learners often skip over essential areas such as data cleaning and validation, assuming they already possess those skills. This leads to data integrity issues down the line. Our path will ensure you dive deep into these areas, armoring your analysis with robust methodologies.

What You Will Be Able to Do After This Path
  • Efficiently manipulate datasets using Pandas and Numpy.
  • Perform complex data cleaning and validation tasks.
  • Visualize data insights using Matplotlib and Seaborn.
  • Implement statistical analysis techniques with Scipy.
  • Communicate findings effectively through reporting in Jupyter Notebooks.
  • Work with APIs to gather and analyze real-time data.
  • Utilize machine learning basics with scikit-learn for data prediction tasks.
The Week-by-Week Syllabus 6 weeks

This path is designed to build your skills progressively, ensuring each week solidifies your understanding before moving on.

What to learn: Pandas DataFrames, series, indexing, and filtering.

Why this comes before the next step: Grasping data structures is critical for effective data analysis.

Mini-project/Exercise: Analyze a CSV dataset and generate descriptive statistics.

What to learn: Handling missing values, duplicates, and outlier detection.

Why this comes before the next step: Clean data is the cornerstone of trustworthy analysis.

Mini-project/Exercise: Clean a messy dataset and document your process.

What to learn: Visualizing data with Matplotlib and Seaborn, understanding different chart types.

Why this comes before the next step: Visuals help convey insights efficiently to stakeholders.

Mini-project/Exercise: Create a dashboard that highlights key metrics using visual aids.

What to learn: Implementing statistical tests, regression, and probability distributions.

Why this comes before the next step: Understanding statistics is crucial for a data-driven approach.

Mini-project/Exercise: Perform a hypothesis test on two datasets and present findings.

What to learn: Structuring reports, writing narrative texts, and embedding visuals within Jupyter Notebooks.

Why this comes before the next step: Effective communication is essential for presenting analytical results.

Mini-project/Exercise: Create a comprehensive analysis report on a chosen dataset.

What to learn: Basics of machine learning, linear regression with scikit-learn.

Why this comes before the next step: Understanding machine learning lays the groundwork for predictive analytics.

Mini-project/Exercise: Build a simple predictive model using historical data.

The Skill Tree — Learn in This Order
  1. Python Basics
  2. Data Structures in Python
  3. Pandas for Data Manipulation
  4. Data Cleaning Techniques
  5. Data Visualization Tools
  6. Statistical Analysis Principles
  7. Reporting with Jupyter Notebooks
  8. Introduction to Machine Learning
Curated Resources — No Filler

Here are essential resources to supplement your learning journey.

Resource Why It's Good Where To Use It
Pandas Documentation Comprehensive resource for mastering data manipulation. Throughout the entire path for reference.
Python for Data Analysis by Wes McKinney A foundational book by the creator of Pandas. Week 1 and 2 for deeper insights.
Data Visualization with Python and Matplotlib Focuses on effective visualization techniques. Week 3 as a visual aid.
Statistics for Data Science Great for brushing up statistical concepts. Week 4 for foundational knowledge.
Kaggle Datasets A rich source of datasets for practice. Throughout the path for hands-on exercises.
Jupyter Notebook Documentation Essential for learning how to present analysis. Week 5 for structuring reports.
Common Traps & How to Avoid Them

Why it happens: Many learners become dependent on following tutorials without understanding the concepts at play. They can run code but struggle with modifications.

Correction: Focus on building projects from scratch. Challenge yourself to analyze datasets without guided steps to reinforce your understanding.

Why it happens: Learners often prioritize analysis speed over data quality, leading to flawed conclusions.

Correction: Dedicate time to data cleaning and validation. Emphasize that good analysis starts with high-quality data.

Why it happens: Some learners skip visual representation, thinking numbers alone convey the message.

Correction: Always complement your findings with visualizations. Check that your insights can be effectively communicated at a glance.

Why it happens: Practicing with curated datasets can lead to a false sense of readiness.

Correction: Actively seek real-world datasets to analyze, which will prepare you for unexpected challenges.

What Comes Next

After completing this path, you should consider diving deeper into specialized areas like data engineering or machine learning. Exploring frameworks like TensorFlow or focusing on data deployment can enhance your skillset significantly. Continuous practice with projects will solidify your learning and keep you relevant in the ever-evolving data landscape.

Open Full Learning Path ↗
CUR-2026-241 Python for Data Analysis ◑ Intermediate 6 weeks 4 min read · 2026-05-14

If You Want to Master Python for Data Analysis, Stop Just Skimming the Surface.

Many learners believe that mastering Python for data analysis is as simple as revisiting NumPy and pandas. This path challenges that notion…

python data-analysis pandas scikit-learn
▾
Why Most People Learn This Wrong

Most intermediate learners get stuck in a vicious cycle of familiarity without truly understanding the tools at their disposal. They believe that knowing just how to use libraries like pandas or Matplotlib is enough, but in reality, they’re merely scratching the surface. This shallow understanding leads to mistakes in data manipulation and visualization, and ultimately, it hampers their ability to derive insights from data.

The common approach involves working on basic projects without diving deeper into data structures, statistics, or advanced visualization techniques. These learners often jump from one tool to another without understanding when and why to apply each solution—leading to a patchwork of skills that don’t connect.

This learning path will force you to dig deeper into topics like statistical analysis, machine learning integration with Python, and advanced visualization techniques using libraries like Seaborn and Plotly. It’s not just about knowing how to use a tool; it’s about mastering the art of data analysis through context and understanding.

What You Will Be Able to Do After This Path
  • Design and implement complex data analysis workflows using Python.
  • Utilize libraries like NumPy and pandas for efficient data manipulation.
  • Create compelling visualizations with Seaborn and Plotly.
  • Integrate machine learning models using scikit-learn for predictive analysis.
  • Perform statistical tests and understand their implications on datasets.
  • Conduct exploratory data analysis (EDA) to derive actionable insights.
  • Optimize data processing pipelines for large datasets.
The Week-by-Week Syllabus 6 weeks

This syllabus is designed to build your skills sequentially, ensuring that each week’s topic lays the groundwork for the next.

What to learn: pandas DataFrames, MultiIndex, and Custom Functions.

Why this comes before the next step: Mastering DataFrames will allow you to manipulate and analyze complex datasets effectively.

Mini-project/Exercise: Build a data cleaning pipeline that imports a messy CSV file and organizes it for analysis.

What to learn: Data visualization with Matplotlib and Seaborn, correlation analysis.

Why this comes before the next step: EDA is critical for uncovering patterns and outliers before diving deeper into analysis.

Mini-project/Exercise: Create a detailed EDA report on a chosen dataset, highlighting key insights and visualizations.

What to learn: Descriptive statistics, hypothesis testing, and confidence intervals.

Why this comes before the next step: Understanding statistical principles will enhance your analysis and validation of data-driven decisions.

Mini-project/Exercise: Conduct hypothesis tests on your EDA dataset to validate insights drawn in the previous week.

What to learn: Introduction to scikit-learn, supervised vs. unsupervised learning, and model evaluation metrics.

Why this comes before the next step: Knowing how to apply machine learning for predictions is essential in advanced data analysis.

Mini-project/Exercise: Build a simple linear regression model to predict a target variable from your dataset.

What to learn: Building data processing pipelines using Airflow or Luigi.

Why this comes before the next step: Automation ensures your workflows are efficient, especially with larger datasets.

Mini-project/Exercise: Automate the data cleaning and analysis pipeline you created in Week 1 and schedule it to run weekly.

What to learn: Interactive visualizations with Plotly and dashboards with Dash.

Why this comes before the next step: Mastering advanced visuals is essential for communicating insights effectively.

Mini-project/Exercise: Develop an interactive dashboard that showcases insights from your analysis in previous weeks.

The Skill Tree — Learn in This Order
  1. Python Basics (if not already known)
  2. Data Structures and Libraries Overview
  3. Advanced DataFrames with pandas
  4. Data Visualization with Matplotlib and Seaborn
  5. Statistical Analysis Fundamentals
  6. Introduction to scikit-learn
  7. Data Pipelines with Airflow or Luigi
  8. Interactive Visualizations with Plotly
Curated Resources — No Filler

Here are essential resources to enhance your learning journey.

Resource Why It's Good Where To Use It
Python for Data Analysis (Book) Comprehensive guide written by Wes McKinney, the creator of pandas. Use it to understand data manipulation in-depth.
Kaggle Datasets Access a wealth of datasets for practice and competitions. Use for mini-projects and competitions.
scikit-learn Documentation Official docs for learning machine learning concepts and implementations. Use as a reference during the ML section.
DataCamp Courses Interactive courses on data science topics; tailored for hands-on learning. Use to reinforce concepts through practice.
Towards Data Science Blog Articles and tutorials on modern data science techniques. Use for real-world application examples and case studies.
Common Traps & How to Avoid Them

Why it happens: Learners often become comfortable with one library and avoid exploring alternatives.

Correction: Challenge yourself by solving the same problem using different libraries to understand their strengths and weaknesses.

Why it happens: Many focus on analysis without ensuring the data is clean and validated.

Correction: Always start your projects with a comprehensive data cleaning step; it’s fundamental.

Why it happens: Learners may manipulate data until the model fits perfectly, ignoring its generalizability.

Correction: Regularly validate your models with unseen data to ensure robustness.

What Comes Next

After completing this path, consider diving deeper into specialized areas such as machine learning, artificial intelligence, or big data analytics. Engage in real-world projects or contribute to open-source data analysis initiatives to solidify your skills and continue your growth.

Also, think about joining a data science community or attending workshops to stay updated with industry trends and tools.

Open Full Learning Path ↗
CUR-2026-083 Python for Data Analysis ★ Expert 6 weeks 4 min read · 2026-05-14

If You Want to Achieve Mastery in Python for Data Analysis, Skip the Basics and Focus on Advanced Techniques.

Most learners get lost in the weeds of basic libraries like Pandas and NumPy. Instead, this path emphasizes the critical advanced skills…

python data-analysis pandas machine-learning
▾
Why Most People Learn This Wrong

Many developers mistakenly spend too much time on surface-level tutorials, thinking that mastering the basics of libraries like Pandas and NumPy will suffice. This leads to a superficial understanding, where learners know how to use functions without grasping the underlying principles of data analysis. They miss critical concepts such as statistical modeling, data pipeline automation, and advanced visualization techniques that are necessary for real-world applications.

This path differs by taking you from that shallow understanding to a deep, nuanced mastery of Python for Data Analysis. Instead of just scratching the surface, we will dive into advanced topics like machine learning integration with scikit-learn, data engineering with Apache Airflow, and complex data visualization techniques using Plotly and Dash. You'll learn not just how to use tools, but when to use them, and why they matter.

Additionally, many learners rely on outdated resources and defeatist mindsets, assuming that expertise is out of reach. This path will provide you with curated resources and a structured approach, ensuring that you develop a robust skill set tailored for today's data-driven landscape.

What You Will Be Able to Do After This Path
  • Implement complex data manipulation techniques using Pandas and Dask.
  • Automate data workflows with Apache Airflow.
  • Create dynamic dashboards and visualizations using Plotly and Dash.
  • Perform advanced statistical analyses with statsmodels.
  • Integrate machine learning algorithms into data analysis tasks using scikit-learn.
  • Design and manage ETL (Extract, Transform, Load) processes with Luigi or Apache NiFi.
  • Conduct A/B testing and business impact analysis on data-driven decisions.
  • Work with big data technologies like Apache Spark for large-scale data analysis.
The Week-by-Week Syllabus 6 weeks

This path is structured to build upon advanced skills in a logical order. Each week focuses on critical topics that prepare you for real-world data challenges.

What to learn: Advanced techniques in Pandas including multi-indexing, group operations, and integrating Dask for larger-than-memory computations.

Why this comes before the next step: Mastering data manipulation is essential before moving on to analysis or visualization, as these skills form the foundation of all data work.

Mini-project/Exercise: Analyze a large dataset (e.g., NY City taxi data) to calculate average fare prices and visualize the results.

What to learn: Setup and manage workflows using Apache Airflow, learn about DAGs (Directed Acyclic Graphs), and task dependencies.

Why this comes before the next step: Automating data workflows is critical for ensuring reliability and efficiency in data processes.

Mini-project/Exercise: Create a DAG that automates the process of fetching, transforming, and loading data from an API.

What to learn: Build interactive dashboards using Plotly and Dash, focusing on user interactions and real-time data updates.

Why this comes before the next step: Effective visualization is key to communicating your analysis and driving business decisions.

Mini-project/Exercise: Develop a dashboard to visualize key metrics from the previous week's dataset.

What to learn: Conduct statistical analyses using statsmodels, including regression models and hypothesis testing.

Why this comes before the next step: Understanding statistical methods is vital for making sense of your data analysis results.

Mini-project/Exercise: Perform regression analysis on your dataset from Week 1 and interpret the results.

What to learn: Implement machine learning algorithms with scikit-learn and learn to evaluate model performance.

Why this comes before the next step: Integrating machine learning into your analysis can improve insights and predictions, adding significant value.

Mini-project/Exercise: Create a predictive model for taxi fare prices based on relevant features from your dataset.

What to learn: Design ETL processes and workflow management with Luigi or Apache NiFi.

Why this comes before the next step: Understanding data engineering is crucial for creating scalable data solutions that integrate your analytical skills.

Mini-project/Exercise: Develop an ETL pipeline that automates data collection and processing for a new dataset.

The Skill Tree — Learn in This Order
  1. Advanced Data Manipulation
  2. Automating Data Workflows
  3. Data Visualization Techniques
  4. Statistical Analysis Fundamentals
  5. Machine Learning Models
  6. Data Engineering Principles
  7. Big Data Technologies
  8. Real-world Application of Insights
Curated Resources — No Filler

Here are essential resources to deepen your understanding and skills in Python for Data Analysis.

Resource Why It's Good Where To Use It
Pandas Documentation Comprehensive source for Pandas functionality and best practices. During data manipulation tasks.
Dask Documentation Essential for understanding parallel computing with Dask. When handling large datasets.
Apache Airflow Documentation Detailed guides on setting up and managing workflows. When automating data processes.
Plotly Documentation Great for learning interactive visualizations. When building dashboards.
Scikit-learn Documentation Invaluable for mastering machine learning algorithms. When implementing predictive models.
Common Traps & How to Avoid Them

Why it happens: Many learners consume endless tutorials without applying what they learn, leading to a lack of practical experience.

Correction: Actively apply concepts through small projects or real data problems to reinforce learning and gain confidence.

Why it happens: It's easy to get caught up in analysis without inspecting and cleaning the data first, leading to flawed conclusions.

Correction: Always start with a data quality assessment and implement robust data cleaning practices before analysis.

Why it happens: Some learners avoid statistical methods, thinking they aren't necessary or too complex.

Correction: Embrace statistics as a foundational skill; it informs better data interpretations and decisions.

What Comes Next

After completing this path, consider diving deeper into specialized areas such as machine learning, big data technologies, or data engineering. Undertaking projects that involve real-world datasets can also enhance your portfolio and expertise. Aim for certifications in data analysis or data science to validate your skills and improve job prospects.

Open Full Learning Path ↗
CUR-2026-401 Python for Data Analysis ★ Expert 6 weeks 4 min read · 2026-05-12

If You Want to Master Python for Data Analysis, Skip the Basics and Dive Deep into Advanced Techniques.

While most self-proclaimed experts skim through basic libraries and techniques, this path will demand your mastery of advanced data manipulation, visualization, and…

python data-analysis dask scikit-learn
▾
Why Most People Learn This Wrong

Many learners falsely believe that to become an expert in Python for data analysis, they must first master every basic concept. This often leads to wasted time on menial tasks instead of delving into the complexities that truly define expertise. Instead of merely memorizing pandas operations or simple matplotlib visualizations, they must confront and conquer advanced methodologies.

Furthermore, too many learners focus on tool usage without understanding the underlying principles of data science. They can produce graphs and analyses but lack the ability to interpret results or apply machine learning models effectively. This shallow understanding creates false confidence and limits their real-world problem-solving skills.

This path will prioritize advanced techniques over rudimentary knowledge, allowing you to tackle problems like data cleaning with dask, complex visualizations with plotly, and predictive analysis using scikit-learn. Mastery comes from practical application and critical thinking, not from surface-level familiarity.

By the end, you won’t just know Python for data analysis; you’ll be able to critically assess data, apply sophisticated techniques, and turn insights into actionable strategies. This is the true mark of expertise.

What You Will Be Able to Do After This Path
  • Manipulate large datasets efficiently using dask.
  • Create interactive visualizations with plotly and dash.
  • Implement advanced statistical models using statsmodels.
  • Perform complex data cleaning and transformation tasks with pandas.
  • Leverage machine learning algorithms from scikit-learn for predictive analytics.
  • Automate data workflows with Airflow.
  • Conduct exploratory data analysis to draw actionable insights.
  • Document and deploy data analysis projects using Jupyter and Docker.
The Week-by-Week Syllabus 6 weeks

This path is calibrated for those ready to tackle advanced data analysis techniques head-on. Each week builds on the last, pushing your skills further.

What to learn: Advanced dask operations, parallel computing, and lazy evaluation.

Why this comes before the next step: Understanding how to efficiently manipulate large datasets is crucial before moving on to data cleaning and visualization.

Mini-project/Exercise: Load a dataset too large for memory and perform complex operations using dask.

What to learn: Complex data transformation strategies, pandas advanced features.

Why this comes before the next step: Clean data is essential for accurate analysis; this week ensures you can prepare data for downstream tasks.

Mini-project/Exercise: Take a messy dataset and prepare it for analysis by applying transformations and cleaning techniques.

What to learn: Creating dynamic, interactive visualizations using plotly and dash.

Why this comes before the next step: Effective communication of data insights relies on powerful visual tools, which are crucial before diving into complex analyses.

Mini-project/Exercise: Build an interactive dashboard that visualizes key metrics from a dataset using dash.

What to learn: Building and interpreting statistical models using statsmodels.

Why this comes before the next step: Statistical modeling bridges the gap between raw data and insights, setting the stage for machine learning applications.

Mini-project/Exercise: Apply a statistical model to a dataset and interpret the results, creating a report on findings.

What to learn: Basics of machine learning algorithms and their implementation using scikit-learn.

Why this comes before the next step: Understanding machine learning fundamentals is vital before applying advanced techniques to real-world datasets.

Mini-project/Exercise: Train and evaluate a machine learning model on a dataset, demonstrating your understanding of accuracy and overfitting.

What to learn: How to set up and manage data workflows using Airflow.

Why this comes before the next step: Automation is key for scaling data analysis processes and ensuring efficiency in large projects.

Mini-project/Exercise: Create a simple data pipeline using Airflow that ingests, processes, and stores data.

The Skill Tree — Learn in This Order
  1. Advanced data manipulation techniques
  2. Data cleaning strategies
  3. Interactive visualization basics
  4. Statistical analysis fundamentals
  5. Introduction to machine learning
  6. Automating workflows
  7. Real-world predictive modeling
  8. Deployment of analytics projects
Curated Resources — No Filler

Here are some handpicked resources that align perfectly with your learning journey.

Resource Why It's Good Where To Use It
Python Data Science Handbook Comprehensive guide covering key Python data analysis libraries. Reference for deep dives into pandas, numpy, and matplotlib.
Official Dask Documentation In-depth resource for mastering Dask's parallel computing capabilities. Use it when implementing and troubleshooting data processing workflows.
Statistical Modeling in Python Explains how to apply statistical models using statsmodels. Great for enhancing statistical analysis skills.
Plotly Dash Documentation Clear instructions and examples for creating interactive dashboards. Refer to it when building visualizations and dashboards.
Hands-On Machine Learning with Scikit-Learn Practical approach to machine learning with focus on scikit-learn. Use it for practical exercises on machine learning models.
Common Traps & How to Avoid Them

Why it happens: Learners often become overly dependent on libraries like pandas and numpy, neglecting to understand the underlying algorithms and logic.

Correction: Spend time understanding how these libraries operate under the hood. Implement fundamental algorithms manually when possible to solidify your understanding.

Why it happens: Many focus solely on producing outputs without grasping their implications, leading to misguided analyses.

Correction: Always ask “what does this mean?” after obtaining results and practice writing interpretative reports based on your findings.

Why it happens: In the rush to deploy machine learning models, learners skip proper evaluation, leading to poor model performance.

Correction: Use robust validation techniques such as cross-validation and confusion matrices to thoroughly test your models before use.

What Comes Next

Once you complete this path, consider specializing further in machine learning or big data analytics. You could dive into deep learning with frameworks like TensorFlow or PyTorch, or focus on deploying your models into production with tools like Flask or FastAPI.

Engage in real-world projects by contributing to open-source or tackling independent challenges to keep your momentum going and sharpen your skills.

Open Full Learning Path ↗
CUR-2026-250 Python for Data Analysis ● Advanced 6-8 weeks 5 min read · 2026-05-10

If You Want to Master Python for Data Analysis, Ditch the Surface-Level Techniques and Follow This Exact Path.

Most learners skim the surface with libraries like Pandas and NumPy without grasping the underlying statistics and machine learning principles. This path…

python data-analysis pandas numpy
▾
Why Most People Learn This Wrong

Many advanced learners mistakenly believe that simply using libraries such as Pandas and NumPy at a surface level is sufficient for mastering data analysis in Python. They rely too heavily on built-in functions without understanding the statistical principles and algorithms driving these tools. This leads to a shallow understanding, where they can manipulate data but struggle to interpret results or make informed decisions based on their analyses.

These learners often skip essential mathematics and statistics courses, thinking they can get by with just coding skills. This choice is detrimental; without a solid background in statistics, they can easily misinterpret data or overlook important insights. This path will not only reinforce your coding abilities but also deepen your understanding of the underlying principles critical to data analysis.

Additionally, relying on pre-packaged solutions and ignoring more complex data environments can limit your growth. Understanding machine learning frameworks like Scikit-learn and TensorFlow is vital, as they often extend beyond basic data manipulation. This path challenges you to integrate these frameworks into your workflow, ensuring you are well-rounded in both analysis and predictive modeling.

What You Will Be Able to Do After This Path
  • Implement advanced data manipulation techniques using Pandas for real-time analytics.
  • Utilize NumPy for high-performance mathematical computations on large datasets.
  • Design and run machine learning models with Scikit-learn for data-driven decision making.
  • Visualize complex data patterns using Matplotlib and Seaborn.
  • Optimize data pipelines with Dask for scalability in big data environments.
  • Apply statistical techniques to interpret results accurately and effectively.
  • Integrate data analysis workflows with Jupyter Notebooks for reproducibility and collaboration.
  • Deploy machine learning models using Flask or FastAPI for real-world applications.
The Week-by-Week Syllabus 6-8 weeks

This path is structured to build upon your existing Python knowledge while emphasizing crucial statistical and machine learning concepts.

What to learn: Dive deep into Pandas with advanced techniques such as pivot tables, multi-indexing, and custom aggregations.

Why this comes before the next step: Mastering data manipulation is crucial as it forms the basis of effective data analysis.

Mini-project/Exercise: Create a comprehensive sales report from a dataset using multiple aggregation methods.

What to learn: Explore advanced functionalities of NumPy, including broadcasting, vectorization, and performance optimization.

Why this comes before the next step: Understanding numerical computations is key to efficiently processing large datasets in subsequent weeks.

Mini-project/Exercise: Optimize a dataset’s calculations to improve performance and demonstrate efficiency gains.

What to learn: Fundamentals of machine learning concepts, including supervised vs. unsupervised learning using Scikit-learn.

Why this comes before the next step: Establishing a solid foundation in machine learning will enable you to build and evaluate models effectively.

Mini-project/Exercise: Implement a simple linear regression model and interpret the results with real-world data.

What to learn: Use Matplotlib and Seaborn for advanced data visualization, focusing on storytelling through data.

Why this comes before the next step: Visualization is essential for conveying insights from your analyses and models.

Mini-project/Exercise: Create a multi-faceted data visualization dashboard to present findings from your previous projects.

What to learn: Learn statistical testing, confidence intervals, and p-values to make data-driven inferences.

Why this comes before the next step: Understanding the statistics behind the data analysis will enhance your interpretation skills significantly.

Mini-project/Exercise: Analyze a dataset and present a comprehensive report of statistical findings along with visualizations.

What to learn: Introduction to deploying models using Flask or FastAPI and creating data pipelines.

Why this comes before the next step: Knowing how to deploy models allows you to turn theoretical knowledge into practical applications.

Mini-project/Exercise: Build a simple web app that uses your trained model to make predictions based on user input.

The Skill Tree — Learn in This Order
  1. Advanced data manipulation with Pandas
  2. Numerical computing using NumPy
  3. Introductory machine learning with Scikit-learn
  4. Data visualization with Matplotlib and Seaborn
  5. Statistical analysis techniques
  6. Deployment of machine learning models
Curated Resources — No Filler

Here are essential resources to deepen your learning and practice.

Resource Why It's Good Where To Use It
Pandas Documentation The official documentation is comprehensive and includes practical examples. Reference when manipulating data with Pandas.
Python for Data Analysis by Wes McKinney This book offers insights directly from the creator of Pandas, perfect for learning best practices. Read while working on advanced Pandas projects.
Statistical Methods for Machine Learning by Dr. S. S. Kumar This book provides solid foundations in statistics for machine learning. Use alongside your machine learning studies.
Scikit-learn Documentation Well-structured and includes examples for various algorithms. Consult when implementing machine learning models.
Kaggle Great platform to practice your skills and engage with real data sets. Use for mini-projects and competitions.
FastAPI Documentation Excellent resource for learning how to deploy APIs for machine learning. Consult when deploying your models.
Common Traps & How to Avoid Them

Why it happens: Advanced learners often lean too heavily on functions in libraries like Pandas without understanding the underlying algorithms.

Correction: Take time to learn and implement the algorithms behind functions to gain deeper insights.

Why it happens: Learners sometimes jump straight to modeling, neglecting crucial preprocessing steps.

Correction: Establish a solid data preprocessing routine by mastering techniques for cleaning and transforming data.

Why it happens: Inexperience can lead to overly complex models that fit training data but fail on unseen data.

Correction: Always split your dataset into training and testing sets and utilize cross-validation techniques.

What Comes Next

After mastering this path, consider specializing in machine learning or data engineering. Both fields are in high demand and require advanced skills in Python. You might also explore areas like deep learning using TensorFlow or Keras for more complex models, or dive into big data tools like Spark to handle larger datasets.

Engaging in real-world projects on platforms like Kaggle or collaborating on open-source projects can also significantly enhance your portfolio and job readiness.

Open Full Learning Path ↗
CUR-2026-045 Python for Data Analysis ★ Expert 8 weeks 5 min read · 2026-05-09

If You Want to Achieve Mastery in Python for Data Analysis, Follow This Exact Path.

Many experts mistakenly jump straight into complex machine learning models without a solid grasp of data manipulation and visualization. This path emphasizes…

python pandas data-analysis data-visualization
▾
Why Most People Learn This Wrong

At the expert level, many experienced programmers fall into the trap of focusing solely on machine learning and predictive models—neglecting the essential groundwork of data cleaning, transformation, and exploration. They think that once they grasp the advanced libraries like scikit-learn or TensorFlow, they will be set. What they fail to realize is that without a strong command over data wrangling, their models will be built on shaky foundations, leading to misleading insights and results. This glaring oversight results in a shallow understanding of the data that ultimately hinders the quality of their analyses.

This learning path is distinctly structured to rectify this mistake. By prioritizing key libraries such as Pandas and Matplotlib first, we ensure that you get the necessary data manipulation finesse before tackling advanced analytical methods. Mastering data exploration and visualization is crucial for developing a contextual understanding of your datasets, which directly feeds into more effective model training down the line. This approach will not only give you deeper insights but also make your machine learning models far more effective.

Ultimately, this path is designed for seasoned developers looking to fill in gaps and enhance their data analysis toolkit, pivoting from code-centric thinking to domain-centric insight.

What You Will Be Able to Do After This Path
  • Efficiently clean and preprocess large datasets using Pandas.
  • Create stunning visualizations with Matplotlib and Seaborn.
  • Implement exploratory data analysis (EDA) techniques to uncover insights.
  • Utilize NumPy for advanced numerical operations.
  • Apply statistical testing and hypothesis validation effectively.
  • Leverage scikit-learn to build and evaluate machine learning models.
  • Automate data ingestion and reporting processes.
  • Communicate findings effectively through interactive dashboards using Plotly and Dash.
The Week-by-Week Syllabus 8 weeks

This path is structured over 8 weeks to ensure a deep, practical understanding of data analysis using Python.

What to learn: Focus on Pandas for data cleaning, handling missing values, and data transformation.

Why this comes before the next step: Understanding how to manipulate raw data is the backbone of any analysis and must precede visualization.

Mini-project/Exercise: Analyze a messy dataset (e.g., a CSV with inconsistencies) and produce a cleaned dataset ready for analysis.

What to learn: Dive into Matplotlib and Seaborn for creating basic plots like line charts, bar graphs, and scatter plots.

Why this comes before the next step: Effective data visualization is essential for presenting findings clearly and requires a solid understanding of data first.

Mini-project/Exercise: Visualize trends in a sample dataset while ensuring clarity and insightfulness in your plots.

What to learn: Explore datasets using statistical measures, visualizations, and uncover trends and patterns using Pandas and Seaborn.

Why this comes before the next step: EDA helps frame your understanding of the data and guides future analysis and modeling choices.

Mini-project/Exercise: Conduct a full EDA on a public dataset (e.g., Titanic dataset) and summarize findings.

What to learn: Master multi-indexing, pivot tables, and merging datasets in Pandas.

Why this comes before the next step: Complex datasets often require advanced manipulation techniques for effective analysis.

Mini-project/Exercise: Merge multiple datasets to create a comprehensive dataset for analysis.

What to learn: Introduction to statistics with SciPy, focusing on hypothesis testing and statistical significance.

Why this comes before the next step: Insights must be validated statistically to ensure reliability before applying machine learning techniques.

Mini-project/Exercise: Perform hypothesis testing on your EDA findings to draw valid conclusions.

What to learn: Gain hands-on experience with scikit-learn, learning to build and evaluate regression and classification models.

Why this comes before the next step: Understanding model building requires a firm grasp of the data manipulation and exploratory techniques.

Mini-project/Exercise: Build a predictive model on a dataset of choice and evaluate its performance.

What to learn: Create interactive visualizations with Plotly and Dash.

Why this comes before the next step: Effective communication of analysis requires sophisticated visualization tools that allow users to interact with data.

Mini-project/Exercise: Build an interactive dashboard to visualize findings from your previous projects.

What to learn: Automate data ingestion and reporting using Airflow and Jupyter Notebooks.

Why this comes before the next step: Automation helps streamline data processes, making insights accessible and reproducible.

Mini-project/Exercise: Create an automated report of your data analysis workflow.

The Skill Tree — Learn in This Order
  1. Fundamentals of Python
  2. Data Handling with Pandas
  3. Data Visualization with Matplotlib and Seaborn
  4. Exploratory Data Analysis
  5. Statistics with SciPy
  6. Predictive Modeling with Scikit-learn
  7. Interactive Visualizations with Plotly
  8. Data Automation Techniques
Curated Resources — No Filler

Here are some essential resources that will guide your learning effectively.

Resource Why It's Good Where To Use It
Pandas Documentation Comprehensive guide and reference for data manipulation. During hands-on exercises with data cleaning.
Python Data Science Handbook by Jake VanderPlas Excellent book covering key libraries and data analysis techniques. Refer to for deep dives into analytics.
Seaborn Documentation Great documentation for creating beautiful statistical graphics. While learning visualization techniques.
Kaggle Offers datasets, competitions, and community-driven insights. For practical projects and challenges.
Udacity Data Analysis Nanodegree Structured learning with mentorship and projects. For guided learning and accountability.
Towards Data Science Blog Up-to-date articles about data analysis techniques and tools. For insights on new methods and trends.
Common Traps & How to Avoid Them

Why it happens: Experts often get enamored with the latest frameworks or libraries, neglecting core principles of data analysis.

Correction: Stay grounded in foundational skills before exploring flashy technologies. Ensure a deep understanding of existing tools.

Why it happens: There's a tendency to use complex visualization techniques that obscure rather than clarify data insights.

Correction: Focus on clarity and simplicity. Use advanced features only if they enhance comprehension.

Why it happens: Many skip over the steps to verify data quality, resulting in flawed analysis.

Correction: Develop a strict protocol for data validation before analysis. Quality data leads to reliable results.

What Comes Next

After completing this path, consider specializing in machine learning or deep learning to further leverage your data analysis skills. You could also dive into business intelligence tools like Tableau for better visualization capabilities. Continuous learning and real-world projects will further solidify your expertise and keep you ahead in the field.

Open Full Learning Path ↗

PAGE 1 OF 3 · 29 LEARNING PATHS INDEXED