
EDU
Home  /  Curated Curriculum
Learning Path Library

CuratedCurriculum

Opinionated, week-by-week learning paths distilled from two decades of building production SaaS — exactly what to learn, in what order, and why. No filler.

34
Learning Paths
16
Tracks
0
Expert Level
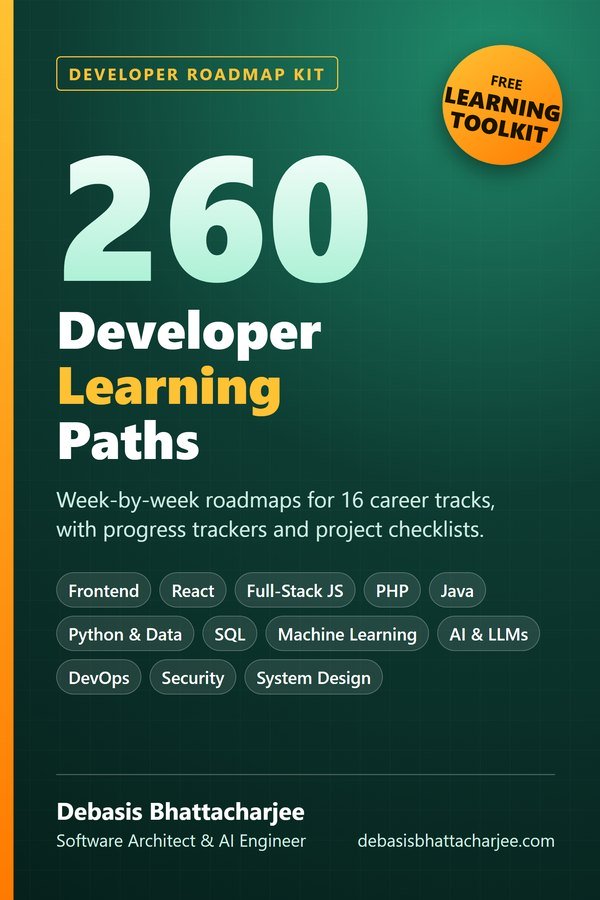
260 Developer Learning Paths PDF cover
Developer Roadmap Kit · PDF

260 Developer Learning Paths, in one PDF

  • Week-by-week roadmaps for 16 career tracks, from Beginner to Expert
  • A progress tracker on every path, so you can see how far you have come
  • Free Learning Toolkit: 6-week schedule, weekly review sheet, project checklist, CV tips
$4.99 one-time · instant email delivery
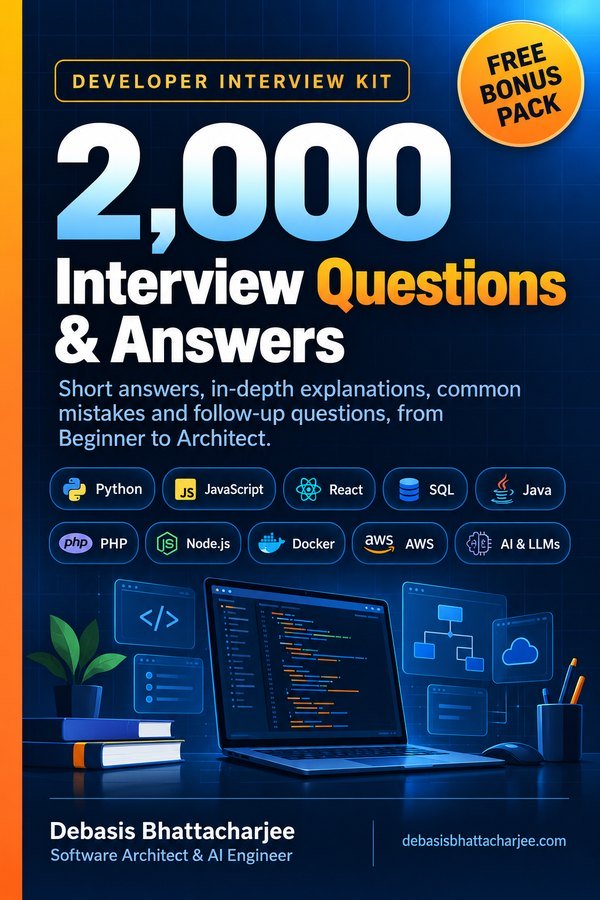
2,000 Interview Questions & Answers cover
Also available: 2,000 Interview Questions & Answers $7.99 The questions developers get asked in interviews, across 89 topics, with short answers, in-depth explanations, common mistakes and follow-ups. See what's inside →

Get both books for $9.99 (save $2.99):

The material stays free to read online. This is the organised, offline, print-ready PDF edition. Secure payment by PayPal; your personal download link is emailed after payment is confirmed. Digital product, no shipping.

✕ Clear

Showing 3 learning paths · Python for Data Analysis · Level: Beginner

Clear filters
CUR-2026-221 Python for Data Analysis ○ Beginner 6 weeks 4 min read · 2026-06-02

Master Python for Data Analysis in 2024: The No-Nonsense Roadmap

While most learners flounder with superficial tutorials, this path dives deep into practical skills that actually matter in data analysis. Stop wasting…

python pandas data-analysis matplotlib
▾
Why Most People Learn This Wrong

Many beginners believe that simply reading Python books or watching endless video tutorials will magically transform them into data analysts. This 'learn by watching' approach creates a false sense of confidence but leaves a shallow understanding of how to apply Python in real-world scenarios.

What often happens is that learners get stuck on syntax and forget the core principles of data manipulation and analysis. They can recite methods but can't execute a data-driven project successfully. This learning path seeks to flip that narrative completely.

Instead of passively absorbing information, this structured path emphasizes hands-on projects, encouraging you to engage with the data and the tools you will actually use in the industry. You will not just learn to code; you will learn to think like a data analyst.

What You Will Be Able to Do After This Path
  • Use Python to clean, analyze, and visualize datasets.
  • Manipulate data using Pandas for effective data wrangling.
  • Create visualizations using Matplotlib and Seaborn.
  • Perform exploratory data analysis (EDA) to extract insights from data.
  • Work with various data formats such as CSV, JSON, and Excel.
  • Implement basic statistical analyses using NumPy.
  • Build a small data-driven project to showcase your skills.
The Week-by-Week Syllabus 6 weeks

This syllabus is designed to take you from zero to data analysis hero in six weeks. You'll build foundational skills and complete mini-projects that solidify your understanding.

What to learn: Basic Python syntax, data types, and control structures.

Why this comes before the next step: Understanding Python fundamentals is crucial for manipulating data effectively.

Mini-project/Exercise: Build a simple Python script that takes user input and performs basic calculations.

What to learn: Dataframe creation, filtering, and basic aggregation with Pandas.

Why this comes before the next step: Pandas is the backbone of data manipulation in Python; mastering it is essential for any analysis.

Mini-project/Exercise: Load a CSV file and perform basic data cleaning and aggregation.

What to learn: Plotting with Matplotlib and Seaborn.

Why this comes before the next step: Visualizing data helps in understanding trends and patterns, which is key to analysis.

Mini-project/Exercise: Create visualizations based on the data cleaned from the previous week.

What to learn: Techniques for EDA including summary statistics and correlation analysis.

Why this comes before the next step: EDA is crucial to uncovering insights that inform decision-making.

Mini-project/Exercise: Analyze a dataset of your choice and write a report summarizing your findings.

What to learn: Data extraction from CSV, JSON, and Excel files.

Why this comes before the next step: Data often comes in various formats; knowing how to handle them expands your capabilities.

Mini-project/Exercise: Create a script that combines data from multiple formats into a single Pandas dataframe.

What to learn: Integrate all skills learned to complete a data analysis project.

Why this comes before the next step: This is your chance to apply everything you've learned in a comprehensive way.

Mini-project/Exercise: Undertake a data analysis project that includes data collection, manipulation, visualization, and a final report.

The Skill Tree — Learn in This Order
  1. Python Basics
  2. Data Structures and Control Flow
  3. Introduction to Pandas
  4. Data Cleaning Techniques
  5. Data Visualization Fundamentals
  6. Exploratory Data Analysis
  7. Handling Data Formats
  8. Capstone Data Analysis Project
Curated Resources — No Filler

These resources will help you deepen your understanding and offer practical exercises.

Resource Why It's Good Where To Use It
Python.org Documentation Official docs are comprehensive and regularly updated. Reference for syntax and libraries.
"Python for Data Analysis" by Wes McKinney The go-to book for learning practical data analysis with Pandas. Deep dive into Pandas and data manipulation.
Kaggle Datasets Real-world datasets to practice your skills. Hands-on projects and competition.
Codecademy Python Course Interactive tutorials that solidify basic Python knowledge. Initial learning phase.
DataCamp's Pandas Course Focused, hands-on learning specifically for data analysis. Practice after mastering the basics.
Common Traps & How to Avoid Them

Why it happens: Learners often feel overwhelmed and think they can just absorb theory. They end up with book smarts but no practical skills.

Correction: Commit to hands-on projects every week. Your learning will stick when you apply it.

Why it happens: Beginners might try to implement complex solutions for simple problems, leading to frustration.

Correction: Start with the simplest solution then iterate for complexity. Use Python’s straightforwardness to your advantage.

Why it happens: Newcomers might underestimate the importance of cleaning data, leading to inaccurate analyses.

Correction: Emphasize data cleaning in your projects; it's often more crucial than the analysis itself.

What Comes Next

Once you've completed this path, consider diving deeper into machine learning with Python. Tools like Scikit-learn and TensorFlow can take your data skills to the next level. Alternatively, work on larger real-world projects or consider contributing to open-source data analysis projects to gain valuable experience.

Open Full Learning Path ↗
CUR-2026-256 Python for Data Analysis ○ Beginner 6 weeks 4 min read · 2026-03-12

If You Want to Master Python for Data Analysis in 2024, Follow This Exact Path

Many beginners jump straight into complex data science concepts without understanding Python fundamentals. This path focuses on building a solid foundation first,…

python pandas data-analysis matplotlib
▾
Why Most People Learn This Wrong

Beginners often rush to use libraries like Pandas or NumPy without first grasping the essentials of Python itself. They think the libraries will do the heavy lifting, but without a solid understanding of Python basics, they miss the crucial nuances. This leads to confusion, errors, and a lack of confidence. You may end up using functions without truly understanding what they're doing.

Moreover, many learners skip hands-on practice for theoretical knowledge, believing hours of video tutorials will suffice. They end up overwhelmed and underprepared when faced with real data challenges. This path ensures you get your hands dirty with practical examples and exercises alongside learning.

Finally, there's a tendency to think of data analysis as merely learning how to create charts or perform calculations. In truth, it involves critical thinking, data cleaning, and problem-solving skills. This path is different: it will build your analytical thinking skills through structured projects that reinforce learning.

What You Will Be Able to Do After This Path
  • Write clean, efficient Python code using basic constructs.
  • Utilize Pandas for data manipulation and analysis.
  • Employ Matplotlib and Seaborn for data visualization.
  • Perform exploratory data analysis (EDA) on datasets.
  • Clean and preprocess data for further analysis.
  • Understand and apply basic statistical concepts to data.
  • Work with Jupyter Notebooks for interactive data analysis.
  • Develop a capstone project showcasing your data analysis skills.
The Week-by-Week Syllabus 6 weeks

This syllabus is designed to take you from Python novice to a competent data analyst within a structured timeframe.

What to learn: Core Python concepts including variables, data types, control flow, and functions.

Why this comes before the next step: Understanding the basics is crucial before moving on to libraries that depend on these fundamentals.

Mini-project/Exercise: Create a simple text-based calculator to practice functions and control flow.

What to learn: Lists, tuples, dictionaries, and sets.

Why this comes before the next step: Knowing these data structures is vital for manipulating data efficiently in data analysis.

Mini-project/Exercise: Develop a program that organizes user input data into a dictionary and retrieves information based on user queries.

What to learn: Loading datasets, basic operations, and data manipulation using Pandas.

Why this comes before the next step: A solid grasp of Pandas is essential for any serious data analysis work.

Mini-project/Exercise: Load a CSV file and perform basic data operations like filtering and summarizing.

What to learn: Visualizing data with Matplotlib and Seaborn.

Why this comes before the next step: Visualization is key to interpreting data effectively, and understanding these libraries will help you present your findings.

Mini-project/Exercise: Create visualizations for the dataset you analyzed last week, highlighting key insights.

What to learn: Techniques for cleaning and preparing data for analysis.

Why this comes before the next step: Clean data is crucial for accurate analysis and insights; without this knowledge, your results can be misleading.

Mini-project/Exercise: Take a messy dataset, clean it using Pandas, and prepare it for further analysis.

What to learn: Apply all skills to a larger data analysis project from start to finish.

Why this comes before entering the job market: This project will serve as your portfolio piece when applying for roles in data analysis.

Mini-project/Exercise: Choose a dataset of interest, conduct EDA, and present your findings using visualizations and a written report.

The Skill Tree — Learn in This Order
  1. Basic Python Syntax
  2. Data Structures (Lists, Tuples, Dictionaries)
  3. Control Flow and Functions
  4. Pandas for Data Analysis
  5. Data Visualization (Matplotlib, Seaborn)
  6. Data Cleaning Techniques
  7. Exploratory Data Analysis
  8. Capstone Project
Curated Resources — No Filler

Here are the essential resources to support your learning journey.

Resource Why It's Good Where To Use It
Automate the Boring Stuff with Python A highly practical book that focuses on real-world Python use cases. Weeks 1-2 for foundational understanding.
Pandas Documentation The official documentation is comprehensive and provides examples for all functionalities. Week 3 for data analysis practices.
Matplotlib and Seaborn Documentation Essential reading for understanding data visualization libraries. Week 4 for visualization projects.
Codecademy's Data Science Path Offers interactive lessons that reinforce learning through exercises. Throughout the path for hands-on practice.
Kaggle Competitions Real datasets to practice and compete with the community. Week 6 for the capstone project.
Common Traps & How to Avoid Them

Why it happens: Many learners are eager to use libraries without mastering Python first, thinking they can get by without the fundamentals.

Correction: Commit to understanding the basics of Python before diving into libraries. This foundational knowledge is what will enable you to troubleshoot and adapt your code.

Why it happens: The abundance of free resources leads to passive learning, where students watch videos instead of actively coding.

Correction: Set a goal to code along with tutorials, and complete hands-on exercises to solidify your understanding rather than just consuming content.

Why it happens: Many beginners underestimate the importance of data cleaning and dive into analysis without preparing their datasets.

Correction: Prioritize learning data cleaning techniques and practice on real messy datasets to understand the impact of this crucial step.

What Comes Next

After completing this path, consider diving deeper into specialized areas such as machine learning with libraries like scikit-learn or gaining more advanced visualization skills with Plotly. Alternatively, you could work on real-world projects and contribute to open-source data analysis projects to enhance your portfolio and network within the data community.

Always keep building your skills and don't hesitate to tackle more complex datasets and analytical problems to keep your momentum going!

Open Full Learning Path ↗
CUR-2026-207 Python for Data Analysis ○ Beginner 6 weeks 4 min read · 2025-12-23

If You Want to Master Python for Data Analysis in 2026, Follow This Exact Path

Many beginners jump straight into libraries like Pandas without understanding the fundamentals, leading to a shallow grasp of data analysis. This path…

python data-analysis pandas numpy
▾
Why Most People Learn This Wrong

It's painfully common for beginners to leap into data analysis with Python by immediately downloading libraries like Pandas and NumPy, hoping that the tools will solve all their problems without first understanding the underlying concepts. This approach often leads to confusion and frustration when trying to troubleshoot errors or when the analysis doesn't yield expected results.

Without a solid grasp of Python basics, such as data types, control structures, and functions, users find themselves lost in the complex functionality of these libraries. They may be able to execute functions but lack the critical thinking skills to analyze their data effectively.

This learning path emphasizes building a strong foundation in Python before moving on to libraries tailored for data analysis. By mastering core programming principles, you’ll not only improve your coding skills but also enhance your ability to think logically when manipulating and analyzing data.

You'll engage with real-world data problems step-by-step, ensuring a much deeper understanding and retention of knowledge. The goal is to empower you to transition from merely executing code to truly understanding data analysis processes.

What You Will Be Able to Do After This Path
  • Write clean, efficient Python code using variables, loops, and functions.
  • Manipulate data using Python's built-in libraries like csv and json.
  • Understand and utilize data types, structures, and basic algorithms.
  • Perform data cleaning and preprocessing with Pandas.
  • Visualize data using Matplotlib and Seaborn.
  • Execute basic statistical analysis on datasets.
  • Create simple data analysis reports and presentations.
  • Work with APIs to extract data for analysis.
The Week-by-Week Syllabus 6 weeks

This path is structured to build your knowledge progressively, ensuring each concept is well understood before moving to the next. Here's how the weeks break down:

What to learn: variables, data types, basic syntax.

Why this comes before the next step: Understanding these core elements is crucial as they form the building blocks of programming and will be necessary for all further work.

Mini-project/Exercise: Create a simple program that asks for user input and displays a personalized greeting.

What to learn: if statements, for loop, while loop, and functions.

Why this comes before the next step: Control structures and functions allow for writing more complex and reusable code, which is essential for effective data manipulation.

Mini-project/Exercise: Write a function that evaluates a list of numbers and returns the even ones.

What to learn: Reading and writing data with csv and json.

Why this comes before the next step: Understanding how to handle different data formats is vital as you will often interact with both structured and unstructured data.

Mini-project/Exercise: Create a program that reads a CSV file, processes it, and outputs a modified CSV file.

What to learn: Introduction to Pandas and NumPy.

Why this comes before the next step: Familiarity with these libraries will allow you to perform more sophisticated data analysis tasks.

Mini-project/Exercise: Load a dataset using Pandas and perform basic data exploration like viewing the head and checking data types.

What to learn: Handling missing values, filtering data, and data transformations with Pandas.

Why this comes before the next step: Clean data is the bedrock of any meaningful analysis, so these skills are crucial.

Mini-project/Exercise: Take a messy dataset, clean it, and prepare it for analysis.

What to learn: Creating visualizations using Matplotlib and Seaborn.

Why this comes before the next step: Being able to visualize data helps convey insights and supports data-driven decision making.

Mini-project/Exercise: Choose a dataset and create a series of visualizations to tell a story about the data.

The Skill Tree — Learn in This Order
  1. Python basics
  2. Control structures
  3. Functions
  4. Data formats (CSV, JSON)
  5. Pandas basics
  6. Data cleaning techniques
  7. Data visualization basics
  8. Basic statistical methods
Curated Resources — No Filler

Here are some top resources to support your learning journey:

Resource Why It's Good Where To Use It
Automate the Boring Stuff with Python Great for beginners focusing on practical programming tasks. Week 1-3
Pandas Documentation Official docs with examples to understand Pandas better. Week 4-5
Python for Data Analysis by Wes McKinney Authoritative guide on using Pandas for data manipulation. Week 4-6
Matplotlib Documentation Comprehensive resource for learning visualization techniques. Week 6
Codecademy Python Track Interactive learning platform with hands-on coding exercises. Week 1-2
Common Traps & How to Avoid Them

Why it happens: Beginners often think they can achieve data analysis without understanding how the libraries work internally.

Correction: Spend time on core Python programming skills before diving deep into libraries; this foundational knowledge will pay off later.

Why it happens: New analysts may assume data is clean or easy to manipulate without verification.

Correction: Always prioritize data cleaning and pre-check your datasets for issues before analysis.

Why it happens: Many learners skip reading the documentation and overlook crucial features.

Correction: Make it a habit to read library documentation; knowledge of available functions can save you a lot of time and frustration.

What Comes Next

After completing this path, consider diving deeper into data analysis by exploring machine learning with libraries like Scikit-Learn or expanding your data visualization skills with Plotly. Another option is to work on real-world projects involving data scraping or exploring APIs for data extraction. These will not only solidify what you’ve learned but also build your portfolio.

Continue your learning momentum by enrolling in specialized courses on platforms like Coursera or edX that focus on these advanced topics.

Open Full Learning Path ↗