
EDU
Home  /  Curated Curriculum
Learning Path Library

CuratedCurriculum

Opinionated, week-by-week learning paths distilled from two decades of building production SaaS — exactly what to learn, in what order, and why. No filler.

260
Learning Paths
16
Tracks
79
Expert Level
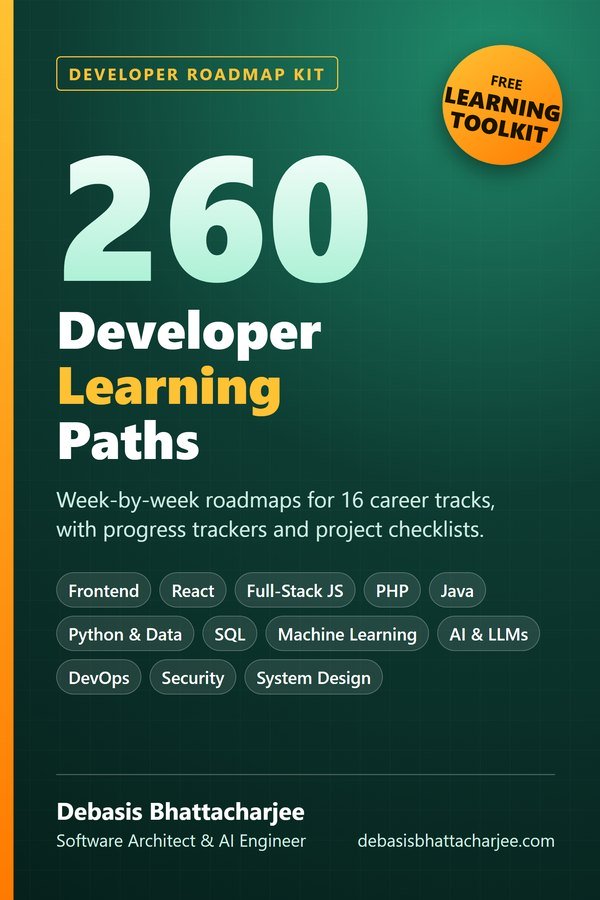
260 Developer Learning Paths PDF cover
Developer Roadmap Kit · PDF

260 Developer Learning Paths, in one PDF

  • Week-by-week roadmaps for 16 career tracks, from Beginner to Expert
  • A progress tracker on every path, so you can see how far you have come
  • Free Learning Toolkit: 6-week schedule, weekly review sheet, project checklist, CV tips
$4.99 one-time · instant email delivery
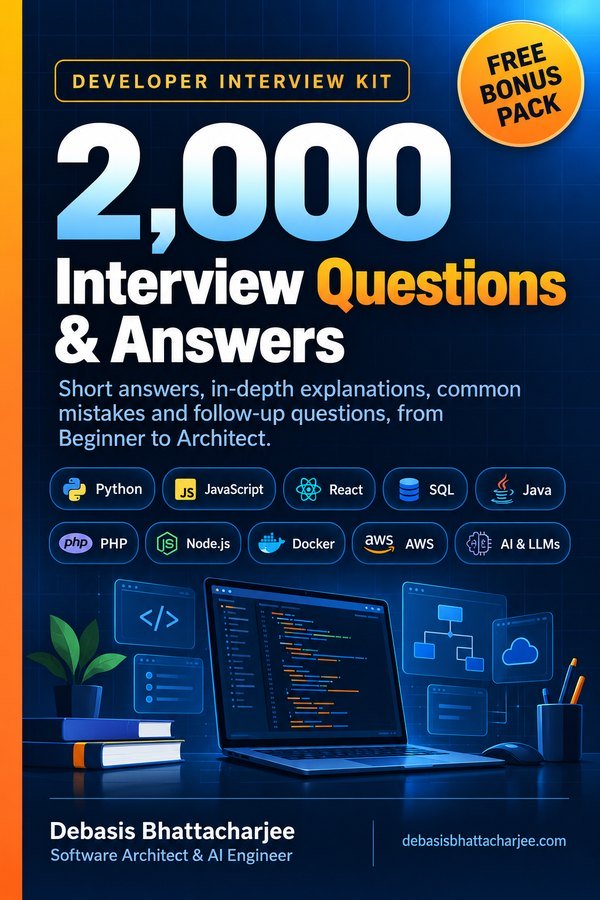
2,000 Interview Questions & Answers cover
Also available: 2,000 Interview Questions & Answers $7.99 The questions developers get asked in interviews, across 89 topics, with short answers, in-depth explanations, common mistakes and follow-ups. See what's inside →

Get both books for $9.99 (save $2.99):

The material stays free to read online. This is the organised, offline, print-ready PDF edition. Secure payment by PayPal; your personal download link is emailed after payment is confirmed. Digital product, no shipping.

✕ Clear

Showing 29 learning paths · Python for Data Analysis

Clear filters
CUR-2026-293 Python for Data Analysis ★ Expert 6 weeks 4 min read · 2026-02-26

If You Want to Master Python for Data Analysis at an Expert Level, Follow This Exact Path.

Many experts mistakenly believe their deep understanding of Python is enough for data analysis, overlooking essential libraries and techniques that make a…

python data-analysis pandas scikit-learn
▾
Why Most People Learn This Wrong

Most experts fall into the trap of assuming their proficiency in Python equates to being proficient in data analysis. They often neglect the specialized libraries crucial for effective data manipulation and statistical modeling. Relying solely on foundational knowledge without delving into libraries like Pandas, Numpy, and Scikit-learn leads to a superficial grasp of data analysis, leaving them ill-prepared for real-world challenges.

This path addresses these gaps head-on, emphasizing not just the libraries but also the methodologies behind them. While many experts avoid learning complex data visualization techniques or advanced statistical models, this can severely limit their capabilities. The goal here is to not just learn but to apply these tools in practical scenarios.

Furthermore, many practitioners overlook the significance of version control and documentation when it comes to collaborative analytics. This path prioritizes these skills, ensuring that experts can work efficiently within teams. By focusing on both the technical and collaborative aspects of data analysis, this structured approach elevates your expertise far beyond what most achieve.

What You Will Be Able to Do After This Path
  • Utilize Pandas and Numpy for advanced data manipulation and cleaning.
  • Implement statistical models using Scikit-learn for predictive analysis.
  • Create impactful visualizations with Matplotlib and Seaborn.
  • Optimize data pipelines with Dask for large datasets.
  • Conduct A/B testing and interpret results within Statsmodels.
  • Utilize Jupyter Notebooks effectively for documentation and presentation of analyses.
  • Implement version control using Git in collaborative data projects.
  • Engage with cloud platforms like AWS for deploying data analysis solutions.
The Week-by-Week Syllabus 6 weeks

This path is structured as a comprehensive exploration of advanced data analysis techniques using Python, focusing on practical applications each week.

What to learn: Master advanced features of Pandas for data cleaning, manipulation, and aggregation.

Why this comes before the next step: Data preparation is crucial; without clean data, analysis is wasted effort.

Mini-project/Exercise: Clean a messy dataset and perform exploratory data analysis (EDA) to derive insights.

What to learn: Delve into Numpy's array operations and performance optimizations.

Why this comes before the next step: Understanding numerical operations is key to efficient data analysis and machine learning.

Mini-project/Exercise: Create a custom statistical function using Numpy arrays to analyze data.

What to learn: Implement machine learning algorithms using Scikit-learn, focusing on feature engineering and evaluation metrics.

Why this comes before the next step: Prediction is a core aspect of data analysis, requiring a solid understanding of modeling techniques.

Mini-project/Exercise: Build a predictive model for a dataset of your choice and evaluate its performance.

What to learn: Explore data visualization libraries, focusing on Matplotlib and Seaborn to create informative plots.

Why this comes before the next step: Visualizing data effectively is essential for communication of results and insights.

Mini-project/Exercise: Create a dashboard of visualizations that tells a story from the dataset you've been working with.

What to learn: Learn how to utilize AWS for deploying scalable data analysis solutions.

Why this comes before the next step: Deploying solutions ensures your analysis is accessible and actionable in real-world scenarios.

Mini-project/Exercise: Deploy a Flask app that serves your model predictions on AWS.

What to learn: Implement Git for version control and collaborative working practices.

Why this comes before the next step: Collaboration is vital in data projects; misuse of version control can lead to chaos.

Mini-project/Exercise: Set up a collaborative project on GitHub, documenting processes and code for team use.

The Skill Tree — Learn in This Order
  1. Python programming fundamentals
  2. Basic data manipulation with Pandas
  3. Numerical operations with Numpy
  4. Visualization basics with Matplotlib
  5. Intermediate statistical modeling
  6. Advanced data manipulation techniques
  7. Machine learning with Scikit-learn
  8. Deployment with AWS
  9. Version control with Git
Curated Resources — No Filler

Here are essential resources to complement your learning journey.

Resource Why It's Good Where To Use It
Pandas Documentation The official docs are comprehensive and provide the best practices for using Pandas. When using Pandas for data manipulation.
Python Data Science Handbook by Jake VanderPlas A deep dive into essential tools for data analysis including practical examples. For understanding the context and applications of each library.
Kaggle Datasets A vast repository of datasets to practice on real-world problems. For mini-projects and exercises.
GitHub Learning Lab Hands-on learning for Git and GitHub to solidify version control skills. When implementing version control in your projects.
AWS Training and Certification Offers free resources to learn about cloud deployment. When preparing to deploy your solutions.
Common Traps & How to Avoid Them

Why it happens: Many experts assume that once they learn a library, they don't need to revisit it. Libraries evolve, and best practices change.

Correction: Make it a habit to regularly check library documentation for updates and new features, adapting your skill set accordingly.

Why it happens: Experts often feel compelled to use the latest algorithms, forgetting simple models can be more effective.

Correction: Focus on model performance metrics and interpretability; sometimes simple linear regression beats complex models.

Why it happens: With confidence in their skills, experts frequently skip documenting their processes.

Correction: Develop a consistent documentation practice from the start to ensure clarity and collaboration.

What Comes Next

After completing this path, consider specializing further in machine learning or AI, where you can apply your analysis skills to predictive modeling and automation. Alternatively, engage in community projects or contribute to open-source data analysis tools to keep honing your skills.

Additionally, pursuing certifications or deepening your understanding of cloud platforms can significantly elevate your expertise in data analysis.

Open Full Learning Path ↗
CUR-2026-389 Python for Data Analysis ◑ Intermediate 6 weeks 4 min read · 2026-02-24

If You Want to Master Python for Data Analysis in 2023, Follow This Exact Path

Many learners stumble by skipping foundational knowledge and diving straight into complex libraries, leading to superficial skills. This path addresses those gaps,…

python pandas data-analysis numpy
▾
Why Most People Learn This Wrong

Most intermediate learners approach Python for Data Analysis by immediately jumping into libraries like Pandas and NumPy without solidifying their understanding of the underlying concepts. They focus on syntax and functions but miss the critical analytical thinking skills necessary to transform data into insights. This creates a shallow understanding that can lead to frustration when faced with real-world data challenges.

Another common error is relying on tutorials that only showcase quick wins without addressing the foundational knowledge that supports advanced analysis. As a result, learners can manipulate data but lack the expertise to design robust analytical processes or interpret results accurately. This path seeks to rectify that by emphasizing a solid grounding in both theory and practice.

This structured approach ensures you not only know how to use the tools but also understand when and why to use them, making you more adaptable in your data analysis career. Each step in this path builds on the last, reinforcing your skills and ensuring you're not just memorizing commands but mastering data analysis.

What You Will Be Able to Do After This Path
  • Perform exploratory data analysis using Pandas and Matplotlib.
  • Implement data cleaning and preprocessing techniques effectively.
  • Use NumPy for numerical computations and array manipulations.
  • Create custom functions and apply them across data sets.
  • Build data visualizations that tell compelling stories.
  • Design and conduct data-driven experiments.
  • Utilize Jupyter Notebooks for interactive data analysis.
  • Integrate statistical analysis using Scipy.
The Week-by-Week Syllabus 6 weeks

This path is designed to build your skills incrementally while providing hands-on experience with real-world data.

What to learn: Pandas, DataFrames, series, and basic operations.

Why this comes before the next step: Mastery of Pandas is essential as it's the backbone of data manipulation in Python.

Mini-project/Exercise: Load a CSV file and perform basic operations to clean and filter the data.

What to learn: Handling missing values, data types, and outlier detection.

Why this comes before the next step: You need a clean dataset for effective analysis, making cleaning an indispensable skill.

Mini-project/Exercise: Create a data cleaning script for a messy dataset using techniques learned.

What to learn: Descriptive statistics, data visualization with Matplotlib and Seaborn.

Why this comes before the next step: EDA is crucial for understanding your data and informing further analysis.

Mini-project/Exercise: Conduct an EDA on a public dataset and visualize the findings.

What to learn: Introduction to Scipy, hypothesis testing, and confidence intervals.

Why this comes before the next step: Understanding statistical foundations is vital for analyzing data meaningfully.

Mini-project/Exercise: Conduct a hypothesis test on your previous EDA findings.

What to learn: Writing custom functions in Python and applying them to data sets.

Why this comes before the next step: Custom functions increase efficiency and versatility in data analysis.

Mini-project/Exercise: Create a function that takes a dataset and performs multiple cleaning and analysis tasks.

What to learn: Integrating all skills learned into a comprehensive analysis.

Why this comes before the next step: A capstone project solidifies your skills and demonstrates your capability.

Mini-project/Exercise: Choose a dataset, perform analysis, and create a report with visual aids.

The Skill Tree — Learn in This Order
  1. Python Fundamentals
  2. Data Structures and Algorithms
  3. Data Visualization Basics
  4. Pandas for Data Manipulation
  5. Data Cleaning Techniques
  6. Exploratory Data Analysis
  7. Statistical Analysis with Scipy
  8. Custom Functions in Python
  9. Capstone Project Development
Curated Resources — No Filler

Here are some top-notch resources to enhance your learning journey.

Resource Why It's Good Where To Use It
Python for Data Analysis by Wes McKinney Comprehensive guide by the creator of Pandas. Reference for learning Pandas and data manipulation techniques.
DataCamp Interactive coding environment with focused courses. Practice Python and data analysis concepts in real-time.
Kaggle Real-world datasets and a community for data projects. Hands-on practice for data cleaning and modeling challenges.
Seaborn Documentation Official docs provide extensive examples and use cases. Use as a reference while implementing visualizations.
Jupyter Notebooks Ideal for interactive data analysis and sharing results. Utilize for projects and presentations of your findings.
Common Traps & How to Avoid Them

Why it happens: Many learners feel confident with Python basics and dive into libraries. However, this leads to gaps in understanding.

Correction: Spend time reinforcing Python fundamentals before moving on to libraries. A solid foundation ensures you can tackle challenges effectively.

Why it happens: It’s easy to fall into the trap of following tutorials step-by-step without grasping concepts.

Correction: Challenge yourself to apply what you learn independently, creating small projects from scratch instead of mimicking tutorials.

Why it happens: Learners may underestimate the importance of clean data, leading to flawed analyses.

Correction: Prioritize data cleaning as an essential part of your workflow, treating it as a critical step in the analysis process.

What Comes Next

After completing this path, consider diving deeper into machine learning with Python using libraries like scikit-learn. Specializing in data science will allow you to apply your analytical skills in predictive modeling and complex data manipulation. You might also explore cloud computing for data analysis, using tools like AWS or Google Cloud for scalable solutions.

Stay curious, keep building your portfolio with diverse projects, and look into further certifications or workshops to enhance your expertise.

Open Full Learning Path ↗
CUR-2026-006 Python for Data Analysis ★ Expert 6 weeks 4 min read · 2026-02-04

If You Want to Master Python for Data Analysis, Skip the Tutorials and Follow This Path.

While most learners get bogged down in endless tutorials and theory, this path dives deep into hands-on projects and real-world applications that…

python data-analysis pandas machine-learning
▾
Why Most People Learn This Wrong

Many learners approach Python for Data Analysis by consuming an overload of tutorials and theoretical resources, often leading to a superficial understanding of concepts like pandas, NumPy, and data visualization. This approach fosters a cycle of dependency on examples without building genuine problem-solving skills. At the expert level, it’s crucial to integrate theory with practical scenarios, which most training paths neglect.

Moreover, many fail to leverage the full power of libraries such as Dask for big data or SciPy for scientific computing, instead opting for simpler frameworks that don’t challenge their existing knowledge or push them to optimize their data workflows. This path emphasizes advanced applications and critical thinking rather than rote memorization.

This structured, project-focused approach will give you the tools and experience needed to tackle complex data analysis tasks, ensuring you understand not just how to use a library, but when and why to choose one over another. Prepare to engage with the data as a storyteller, not just as a technician.

What You Will Be Able to Do After This Path
  • Conduct high-level statistical analysis using statsmodels and scipy.
  • Efficiently process large datasets with Dask for scalable data analysis.
  • Create interactive data visualizations with Plotly and Dash.
  • Automate data ETL processes using Airflow and pandas.
  • Build and deploy machine learning models using scikit-learn and TensorFlow.
  • Integrate Python scripts with SQL databases using SQLAlchemy.
  • Design and implement pipelines for real-time data analytics.
  • Use Jupyter Notebooks for documentation and presentation of analytic findings.
The Week-by-Week Syllabus 6 weeks

This path is structured to progressively build your skills through hands-on projects and real-world applications, ensuring a thorough understanding of advanced data analysis techniques.

What to learn: Advanced features of pandas, including pivot_table, groupby, and custom functions.

Why this comes before the next step: Mastering data manipulation is crucial for any data analysis, setting the foundation for all subsequent work.

Mini-project/Exercise: Analyze a public dataset (e.g., from Kaggle) and present insights focusing on complex transformations.

What to learn: Installation and usage of Dask for parallel computing and big data analysis.

Why this comes before the next step: Dask allows you to handle larger-than-memory datasets, a necessary skill when working with modern data.

Mini-project/Exercise: Process a large dataset with Dask and compare performance to standard pandas operations.

What to learn: Conduct advanced statistical analysis using statsmodels for regression modeling.

Why this comes before the next step: Understanding statistical principles is essential for validating your analysis and making informed decisions.

Mini-project/Exercise: Create a regression model to predict outcomes based on a given dataset and interpret the findings.

What to learn: Building interactive plots and dashboards with Plotly and deploying applications using Dash.

Why this comes before the next step: Effective visualization is key to communicating insights clearly and engagingly.

Mini-project/Exercise: Build a dashboard that visualizes the results of your previous statistical analysis.

What to learn: Set up workflows and automate data extraction, transformation, and loading (ETL) with Apache Airflow.

Why this comes before the next step: Automation is vital for scaling data operations and ensuring consistency.

Mini-project/Exercise: Create an ETL pipeline for a dataset that updates and processes real-time data.

What to learn: Use scikit-learn and TensorFlow to build predictive models and integrate them with your data workflows.

Why this comes before the next step: Machine learning enriches data analysis by adding predictive capabilities, a must for modern analysts.

Mini-project/Exercise: Build a machine learning model on your dataset, deploy it, and analyze its performance.

The Skill Tree — Learn in This Order
  1. Advanced Python Programming
  2. Data Manipulation with Pandas
  3. Data Analysis Fundamentals
  4. Statistical Analysis with Statsmodels
  5. Scalable Data Processing with Dask
  6. Data Visualization with Plotly
  7. Automating Data Workflows with Airflow
  8. Machine Learning with Scikit-Learn
  9. Deploying Data Applications
Curated Resources — No Filler

Here’s a selection of the best resources to deepen your understanding and put the skills you learn into practice.

Resource Why It's Good Where To Use It
Pandas Documentation The official documentation is comprehensive and includes examples for advanced features. During Week 1 and ongoing reference.
Python Data Science Handbook A practical book focusing on essential libraries like NumPy, Pandas, and Matplotlib. Throughout the course for deeper insights.
Real Python Tutorials High-quality tutorials that cover Python data analysis in-depth. For additional learning and practice.
DataCamp Courses Hands-on exercises that reinforce concepts with real datasets. As supplemental learning for practical experience.
Towards Data Science Articles Rich articles and case studies that showcase real-world applications. To gain insights and inspiration for projects.
Kaggle Competitions Real-world challenges that allow you to apply your knowledge and compete with others. For practical application and experience.
Common Traps & How to Avoid Them

Why it happens: Many experts become too comfortable with libraries like pandas and Dask, losing the fundamental understanding of the underlying processes.

Correction: Regularly engage in exercises that require manipulation of raw data without the aid of libraries to strengthen your foundational skills.

Why it happens: Analysts often underestimate the importance of cleaning and preprocessing data before analysis.

Correction: Integrate data cleaning as a mandatory step in every analytical project, using tools like pandas and numpy to ensure quality data.

Why it happens: It's easy to overlook documentation during rapid development, but this leads to confusion later.

Correction: Adopt a habit of documenting your code and analysis decisions thoroughly for future reference and clarity.

What Comes Next

After completing this path, consider diving deeper into machine learning with specialized tracks focusing on deep learning or data engineering. Projects involving real-time data analytics or contributing to open-source data-driven projects can further solidify your expertise and expand your portfolio.

Open Full Learning Path ↗
CUR-2026-227 Python for Data Analysis ★ Expert 6 weeks 4 min read · 2026-02-01

If You Want to Master Python for Data Analysis, This Is the Only Path to Take.

Most experts think they've mastered Python for data analysis simply by reading books or taking surface-level courses. This path dives deep into…

python pandas machine-learning data-visualization
▾
Why Most People Learn This Wrong

Many aspiring experts in Python for data analysis make the mistake of skimming through libraries like Pandas and NumPy without fully understanding their intricacies. They rely heavily on tutorials that gloss over the underlying principles of data manipulation and visualization, leading to a shallow grasp of the topic. This results in developers who can paste code without comprehension, making them unprepared for real-world challenges.

Additionally, they often ignore the importance of data storytelling—focusing solely on analysis without effectively communicating findings. This undermines their analyses and limits their impact in a business context. An expert should not only analyze data but also present it compellingly and clearly.

This path is different. We will emphasize deep understanding, practical applications, and the storytelling aspect of data analysis. You will not only learn to use libraries but also the theory behind them, ensuring you can tackle advanced problems with confidence.

This rigorous approach ensures that by the end of the learning path, you won’t just be an expert in Python; you’ll be a master of data-driven narratives.

What You Will Be Able to Do After This Path
  • Develop complex data pipelines using Apache Airflow for workflow management.
  • Utilize PySpark for large-scale data processing and analysis.
  • Create advanced visualizations with Plotly and Dash.
  • Implement machine learning models using scikit-learn and TensorFlow.
  • Perform statistical analysis using Statsmodels for hypothesis testing.
  • Craft compelling data stories with Tableau integration.
  • Optimize performance in data processing using Numba and CuPy.
  • Automate reporting and insights generation with Jupyter Notebooks and Voila.
The Week-by-Week Syllabus 6 weeks

This structured syllabus is designed to build your proficiency progressively, layering complex skills over foundational knowledge.

What to learn: DataFrame operations, groupby, pivot_table, and merge functions.

Why this comes before the next step: Mastering data manipulation is crucial for any analysis and ensures you're equipped to handle real-world datasets effectively.

Mini-project/Exercise: Analyze a public dataset (like the Titanic dataset) and produce a report summarizing insights using advanced Pandas techniques.

What to learn: Custom plot styling, FacetGrid in Seaborn, and interactive visualizations with Matplotlib.

Why this comes before the next step: Effective visualization is key to communicating data insights, making this a foundational skill for presenting your analysis.

Mini-project/Exercise: Create a series of visualizations that tell a story about trends in a dataset and present them as a slideshow.

What to learn: Using OLS regression, hypothesis testing, and model diagnostics.

Why this comes before the next step: Understanding statistical models will allow you to validate your findings with solid evidence, critical for data-driven decision-making.

Mini-project/Exercise: Perform hypothesis testing on your previous week's visualizations and document your conclusions.

What to learn: Supervised vs. unsupervised learning, model tuning, and cross-validation techniques.

Why this comes before the next step: Applying machine learning principles expands your ability to extract insights and predictions from datasets.

Mini-project/Exercise: Develop a predictive model based on a dataset and evaluate its performance using appropriate metrics.

What to learn: RDD transformations, DataFrames, and Spark SQL for big data analytics.

Why this comes before the next step: As data continues to grow, being adept in big data tools is essential for modern data analysis tasks.

Mini-project/Exercise: Analyze a large dataset using PySpark and compare the results with your previous analyses.

What to learn: DAG creation, task dependencies, and scheduling for automated data workflows.

Why this comes before the next step: Building efficient data pipelines is critical for managing and maintaining data workflows in production settings.

Mini-project/Exercise: Create an end-to-end data pipeline that automates data extraction, transformation, and loading (ETL) processes.

The Skill Tree — Learn in This Order
  1. Data manipulation basics with Pandas
  2. Data visualization techniques with Matplotlib
  3. Statistical concepts and application with Statsmodels
  4. Introduction to machine learning with scikit-learn
  5. Big data concepts with PySpark
  6. Data pipeline development with Apache Airflow
Curated Resources — No Filler

Below are essential resources that provide depth and practical insights into Python for data analysis.

Resource Why It's Good Where To Use It
Python for Data Analysis by Wes McKinney In-depth exploration of Pandas and data analysis techniques. Week 1 and 2
Hands-On Machine Learning with Scikit-Learn, Keras, and TensorFlow Comprehensive guide to machine learning with practical examples. Week 4
Statistical Learning by Hastie, Tibshirani, and Friedman Strong theoretical foundation in statistical modeling. Week 3
Spark: The Definitive Guide Complete overview of using PySpark for big data. Week 5
Airflow Documentation Official docs for setup and best practices. Week 6

Why it happens: Learners can become obsessed with mastering specific tools instead of understanding the underlying principles.

Correction: Balance your time between using tools and grasping the concepts they embody. Focus on 'why' rather than 'how'.

Common Traps & How to Avoid Them

Why it happens: Many experts feel overconfident and skip foundational skills, believing they can learn on the go.

Correction: Spend time mastering the core libraries like Pandas and NumPy; this investment pays off in the complexity of your later work.

Why it happens: With a focus on technical skills, many overlook the ethical implications of data usage.

Correction: Always incorporate discussions on data privacy and bias into your learning. Consider ethical frameworks when analyzing data.

What Comes Next

After completing this path, consider diving into specialized tracks such as machine learning deployment or advanced data visualization techniques. You might also want to work on a real-world project that involves end-to-end data analysis, which will further cement your skills and demonstrate your capabilities to potential employers.

Stay connected with the latest trends in data science and consider contributing to open-source projects or writing technical articles to maintain your momentum and visibility in the field.

Open Full Learning Path ↗
CUR-2026-054 Python for Data Analysis ● Advanced 6 weeks 4 min read · 2026-01-21

If You Want to Conquer Advanced Python for Data Analysis, Follow This Exact Path.

Many learners skim the surface, relying on libraries without understanding their underpinnings. This path digs deeper, equipping you to not only use…

python pandas data-analysis dask
▾
Why Most People Learn This Wrong

At the advanced level, too many learners stick to just applying libraries like Pandas and NumPy without understanding the core principles behind data manipulation and analysis. This creates a superficial skill set that may look impressive but lacks depth. When you rely heavily on pre-built functionalities without grasping their intricacies, you miss the chance to innovate or troubleshoot effectively. The outcome? A developer who can execute tasks but often struggles when faced with unexpected challenges.

This path shifts the paradigm. Instead of just using tools, you'll deconstruct them. You'll learn to create custom functions, optimize performance using libraries like Cython, and even contribute to open-source data projects. This way, you'll gain a nuanced understanding that empowers you to adapt and innovate in any analytical situation.

Furthermore, many learners neglect the importance of statistical fundamentals and advanced visualization techniques. They rush through the practical applications without grounding themselves in theory, resulting in analyses that can mislead rather than inform. This learning path ensures that you solidify your theoretical knowledge alongside practical skills, transforming you into a well-rounded data analyst.

What You Will Be Able to Do After This Path
  • Implement custom data manipulation techniques using Pandas and NumPy.
  • Optimize data processing workflows with Dask.
  • Create advanced visualizations using Plotly and Seaborn.
  • Conduct and communicate complex statistical analyses using Scipy.
  • Write performant Python code with Cython and Numba.
  • Contribute to and utilize open-source data analysis projects on GitHub.
  • Design and execute experiments using statsmodels.
  • Automate data workflows and reporting processes with Airflow.
The Week-by-Week Syllabus 6 weeks

This curriculum is structured to build your skills methodically, ensuring that each topic prepares you for the next.

What to learn: Deep dive into DataFrames, multi-indexing, and advanced grouping techniques.

Why this comes before the next step: Mastering these advanced techniques provides a solid foundation for handling complex data manipulations.

Mini-project/Exercise: Analyze a multi-dimensional dataset and present insights using multi-indexing techniques.

What to learn: Implement Dask for large-scale data manipulation.

Why this comes before the next step: Understanding Dask's parallel computing capabilities is essential for handling datasets that exceed memory limits.

Mini-project/Exercise: Process a large dataset and compare the performance of Dask with Pandas.

What to learn: Perform hypothesis testing, regression analysis, and data fitting using Scipy.

Why this comes before the next step: Strong statistical analysis skills are crucial for validating your data-driven decisions.

Mini-project/Exercise: Conduct a comprehensive analysis to test a hypothesis and visualize the results.

What to learn: Create interactive visualizations with Plotly and enhance static ones with Seaborn.

Why this comes before the next step: Effective communication of data insights relies on mastering various visualization techniques.

Mini-project/Exercise: Develop an interactive dashboard presenting the key insights from a dataset of your choice.

What to learn: Use Cython and Numba to optimize performance-critical sections of your code.

Why this comes before the next step: Performance optimization is key when dealing with large-scale data analysis tasks.

Mini-project/Exercise: Refactor a data processing script for performance and benchmark improvements.

What to learn: Implement data pipelines and automate workflows using Apache Airflow.

Why this completes the path: Automation is a critical skill for ensuring efficiency and reproducibility in data analysis.

Mini-project/Exercise: Create a simple data pipeline that extracts, transforms, and loads data to a database.

The Skill Tree — Learn in This Order
  1. Advanced Pandas Techniques
  2. Dask for Large Data
  3. Statistical Analysis with Scipy
  4. Data Visualization with Plotly and Seaborn
  5. Code Optimization with Cython and Numba
  6. Automating Workflows with Apache Airflow
Curated Resources — No Filler

Here are some top resources to reinforce your learning process.

Resource Why It's Good Where To Use It
Pandas Documentation Comprehensive coverage of Pandas functionalities. Reference for advanced techniques.
Python Data Science Handbook Great book for applying Python to data science. Use alongside the syllabus for deeper insights.
Scipy Documentation Extensive resources on statistical functions. Refer for statistical analysis exercises.
Plotly Official Documentation In-depth guide on creating interactive visuals. Reference while working on visualization projects.
Dask Documentation Excellent resource for scaling up your data analysis. Use for understanding parallel computing.
Airflow Documentation Thorough explanation of workflow automation. Use while learning data pipeline automation.
Common Traps & How to Avoid Them

Why it happens: Many learners focus solely on analysis techniques while neglecting the quality of the data being analyzed.

Correction: Always start with a data quality assessment, checking for missing values, outliers, and inconsistencies before diving into analysis.

Why it happens: Learners often become too comfortable with libraries, blindly using functions without understanding their implications.

Correction: Take time to dissect how these libraries work under the hood, and understand the mathematical principles they implement.

Why it happens: Learners often skip reading documentation, favoring quick tutorials that may provide incomplete information.

Correction: Commit to reading official documentation for the technologies you use, as they offer in-depth knowledge and usage examples.

What Comes Next

After completing this path, consider specializing in machine learning with frameworks like TensorFlow or PyTorch. Alternatively, dive deeper into big data technologies like Spark to analyze and process large datasets efficiently. Engaging with real-world projects or contributing to open-source data tools can also help solidify your skills while expanding your portfolio.

Open Full Learning Path ↗
CUR-2026-231 Python for Data Analysis ◑ Intermediate 6 weeks 4 min read · 2025-12-26

If You Want to Master Python for Data Analysis, Stop Skimming the Surface and Dive Deep.

Most learners incorrectly believe that knowing a few libraries like Pandas and NumPy is enough; this path ensures you build a robust…

python data-analysis pandas seaborn
▾
Why Most People Learn This Wrong

Many intermediate learners in Python for Data Analysis make the critical mistake of scratching the surface with libraries without grasping the underlying data science concepts. They often rush through tutorials, focusing on completing small projects without understanding the 'why' behind their choices. This leads to a shallow understanding that results in frustration when faced with real-world problems. They become proficient with syntax but fail to leverage Python’s full potential in data analysis.

This path diverges from the common approach by emphasizing critical thinking and problem-solving skills alongside library usage. It’s not just about writing code; it's about understanding data pipelines, statistical principles, and visualization techniques. You’ll learn to ask the right questions, streamline your data workflow, and make informed decisions based on exploratory data analysis.

Moreover, many learners overlook the importance of version control and reproducibility in their projects. They learn to execute analyses without documenting their work or collaborating efficiently. This can lead to significant setbacks when sharing results or scaling analyses. In this learning path, we will address these practicalities, ensuring you’re not only writing code but also sharing it effectively in professional environments.

What You Will Be Able to Do After This Path
  • Conduct comprehensive exploratory data analysis (EDA) using Pandas and Seaborn.
  • Implement statistical tests and interpret their results using Scipy.
  • Create interactive visualizations with Plotly and Dash.
  • Automate data cleaning and preprocessing workflows using Pandas.
  • Build and document reproducible analysis pipelines using Jupyter Notebooks.
  • Utilize version control effectively with Git for collaborative projects.
  • Communicate data-driven insights clearly through well-structured reports.
The Week-by-Week Syllabus 6 weeks

This structured syllabus will guide you through the key concepts and technologies needed to deepen your Python data analysis skills.

What to learn: Pandas for data manipulation, handling missing values, and merging datasets.

Why this comes before the next step: Mastering data manipulation is foundational; it sets the stage for effective analysis and exploration.

Mini-project/Exercise: Clean and merge two datasets from Kaggle, documenting your process in a Jupyter notebook.

What to learn: Basic visualization techniques using Matplotlib and Seaborn.

Why this comes before the next step: Visualizations help in understanding data distributions and relationships, which is critical before diving into EDA.

Mini-project/Exercise: Create visualizations for the cleaned datasets from Week 1, highlighting key insights.

What to learn: Advanced EDA techniques using Pandas and Seaborn, including correlation matrices and pair plots.

Why this comes before the next step: EDA is vital for hypothesis generation and informs the subsequent analysis process.

Mini-project/Exercise: Conduct EDA on a new dataset and present your findings in a report.

What to learn: Implementing statistical tests such as t-tests, chi-squared tests using Scipy.

Why this comes before the next step: Understanding statistical principles is crucial for validating your findings and drawing conclusions.

Mini-project/Exercise: Analyze the results of your EDA from Week 3 with statistical tests, documenting your findings.

What to learn: Creating interactive visualizations and dashboards with Plotly and Dash.

Why this comes before the next step: Communicating insights effectively requires mastery of both static and interactive visualizations.

Mini-project/Exercise: Build an interactive dashboard that visualizes your analysis results from Week 4.

What to learn: Best practices for documenting your work in Jupyter Notebooks and using Git for version control.

Why this comes before the next step: Proper documentation and version control are essential for collaborating in team settings and ensuring reproducibility.

Mini-project/Exercise: Refactor one of your previous projects by adding documentation and pushing it to a GitHub repository.

The Skill Tree — Learn in This Order
  1. Basic Python programming
  2. Data structures in Python
  3. Pandas for data manipulation
  4. Data visualization with Matplotlib
  5. Statistical concepts and tests
  6. Exploratory Data Analysis (EDA)
  7. Advanced visualizations with Plotly
  8. Documenting and version controlling with Git
Curated Resources — No Filler

Here are the essential resources you need for this learning path.

Resource Why It's Good Where To Use It
Pandas Documentation Comprehensive guide, official tutorials, and use cases. Week 1 and on for data manipulation.
Python for Data Analysis by Wes McKinney In-depth insights into data manipulation with practical examples. Throughout the course for deeper understanding.
Seaborn Documentation Essential for understanding advanced visualization techniques. Week 2 and EDA.
Statistical Methods for Data Science by Peter Bruce Clear explanations of statistical tests and applications. Week 4 for statistical analysis.
Plotly Dash Documentation Best practices for creating interactive dashboards. Week 5 for building dashboards.
Git Documentation Essential for learning version control and collaborative practices. Week 6 for final project management.
Common Traps & How to Avoid Them

Why it happens: Many intermediate learners underestimate the importance of data cleaning, often jumping straight to analysis with messy data.

Correction: Dedicate time in your projects for thorough data cleaning using Pandas. Treat this as a crucial step in the analysis pipeline, not just a formality.

Why it happens: It’s easy to focus solely on the coding and analysis, neglecting to document your findings and processes.

Correction: Make documentation a priority from the start. Use Jupyter Notebooks effectively to explain your code and results.

Why it happens: Some learners only focus on tools without understanding the underlying statistical concepts.

Correction: Invest time in learning the statistical foundations. Engage with resources that explain why tests are performed and how to interpret results.

What Comes Next

After completing this path, consider diving deeper into specific areas like machine learning by exploring libraries such as scikit-learn or TensorFlow. You may also look into data engineering practices and tools like Apache Airflow for building robust data pipelines. Continual practice and exploring real-world projects will solidify your knowledge and keep your skills sharp.

Open Full Learning Path ↗
CUR-2026-025 Python for Data Analysis ◑ Intermediate 6 weeks 4 min read · 2025-12-25

If You Want to Master Python for Data Analysis, Follow This Exact Path.

Most learners think diving into libraries like Pandas and NumPy is enough. This path emphasizes not just usage, but deep understanding and…

python pandas numpy data-analysis
▾
Why Most People Learn This Wrong

Many intermediate learners jump straight into data analysis tools without a solid foundation in the underlying principles. They often skim through tutorials on libraries like Pandas and NumPy, picking up snippets of code but missing the critical context behind the functions. This creates a superficial understanding that fails when faced with real-world data challenges.

Another common pitfall is the reliance on pre-built functions without grasping what happens under the hood. If you don’t understand how data structures work or how data manipulation algorithms function, you’ll struggle to troubleshoot when things don’t go as planned. This path addresses that gap by ensuring you build a robust mental model of data manipulation.

This structured approach also emphasizes applied projects that reinforce learning. It’s not enough to complete online exercises; you need to tackle real datasets and derive insights, which is what this roadmap focuses on. By the end of this path, you won't just know how to use Python for data analysis; you'll understand why it works, enabling you to adapt and innovate.

What You Will Be Able to Do After This Path
  • Utilize advanced Pandas functions for data manipulation and cleaning.
  • Implement statistical analysis using SciPy and StatsModels.
  • Create compelling visualizations with Matplotlib and Seaborn.
  • Handle large datasets efficiently with Dask.
  • Perform exploratory data analysis (EDA) to identify trends and patterns.
  • Automate data workflows using Jupyter Notebooks effectively.
  • Integrate SQL queries for data extraction and analysis.
  • Present data findings with clear storytelling techniques.
The Week-by-Week Syllabus 6 weeks

This syllabus balances theory and practical projects to solidify your skills in using Python for data analysis.

What to learn: Explore GroupBy, Pivot Tables, and Merging dataframes in Pandas.

Why this comes before the next step: Mastering these techniques is crucial for manipulating complex datasets effectively.

Mini-project/Exercise: Analyze a dataset of your choice by cleaning, merging, and visualizing the data using these techniques.

What to learn: Understand statistical tests and linear regression using scipy.stats and statsmodels.

Why this comes before the next step: Statistical knowledge will allow you to make data-driven decisions and validate your findings.

Mini-project/Exercise: Conduct a hypothesis test on a dataset and interpret the results.

What to learn: Create various plots and visualizations using matplotlib.pyplot and seaborn.

Why this comes before the next step: Strong visual communication skills are essential to convey insights effectively.

Mini-project/Exercise: Visualize the findings from your Week 2 project to communicate your analysis clearly.

What to learn: Work with large datasets using Dask DataFrames and learn about lazy evaluation.

Why this comes before the next step: Understanding how to handle large datasets prepares you for real-world data scenarios where memory efficiency matters.

Mini-project/Exercise: Apply Dask to analyze a larger version of a dataset from previous weeks, focusing on performance.

What to learn: Use SQLAlchemy to connect and run queries on a database.

Why this comes before the next step: Accessing and querying data is fundamental to effective data analysis.

Mini-project/Exercise: Create a Python script that extracts data from a SQL database, performs analysis, and outputs the results.

What to learn: Combine all skills to conduct an end-to-end data analysis project using Python.

Why this comes before the next step: This comprehensive project synthesizes all previously learned skills, leading to mastery.

Mini-project/Exercise: Choose a dataset, formulate a question, perform EDA, analysis, and create a presentation visualizing your findings.

The Skill Tree — Learn in This Order
  1. Advanced Python Programming (functions, classes)
  2. Pandas for Data Manipulation
  3. Statistical Analysis Basics
  4. Data Visualization Principles
  5. Large Dataset Handling with Dask
  6. SQL Basics and Integration
  7. Exploratory Data Analysis Techniques
  8. Data Storytelling and Presentation Skills
Curated Resources — No Filler

Here are essential resources to deepen your understanding of Python for data analysis.

Resource Why It's Good Where To Use It
Pandas Official Documentation Comprehensive and up-to-date guides on all Pandas functionalities. Refer for advanced usage and functions.
'Python for Data Analysis' by Wes McKinney Written by the creator of Pandas, this book is foundational. Read for a deeper understanding of data manipulation.
Seaborn Documentation Offers excellent examples for data visualization. Use for reference while creating plots.
DataCamp Interactive platform with courses on data analysis tools. Practice coding in a hands-on environment.
Kaggle Datasets A vast collection of datasets for practice. Use for your mini-projects and practice exercises.
Real Python Great tutorials and articles on various Python topics. Utilize for supplemental knowledge and practical examples.
Common Traps & How to Avoid Them

Why it happens: Many learners depend heavily on tutorial videos without practicing independently.

Correction: After each tutorial, spend time applying the concepts with your own projects to reinforce learning.

Why it happens: Many rush into analysis without cleaning their data thoroughly.

Correction: Always begin your data analysis process with a systematic cleaning phase to ensure accuracy.

Why it happens: Some skip understanding the 'why' behind analytical methods and just follow procedures.

Correction: Always ask 'why' during every step of analysis to foster critical thinking and deeper comprehension.

What Comes Next

After completing this path, consider specializing in machine learning with Python, perhaps taking a course on Scikit-learn or diving deeper into deep learning with TensorFlow. Alternatively, you can focus on data engineering skills by learning about ETL processes and tools like Apache Airflow. Staying engaged with real-world projects and contributing to open-source data analysis projects will also help maintain your momentum.

Open Full Learning Path ↗
CUR-2026-207 Python for Data Analysis ○ Beginner 6 weeks 4 min read · 2025-12-23

If You Want to Master Python for Data Analysis in 2026, Follow This Exact Path

Many beginners jump straight into libraries like Pandas without understanding the fundamentals, leading to a shallow grasp of data analysis. This path…

python data-analysis pandas numpy
▾
Why Most People Learn This Wrong

It's painfully common for beginners to leap into data analysis with Python by immediately downloading libraries like Pandas and NumPy, hoping that the tools will solve all their problems without first understanding the underlying concepts. This approach often leads to confusion and frustration when trying to troubleshoot errors or when the analysis doesn't yield expected results.

Without a solid grasp of Python basics, such as data types, control structures, and functions, users find themselves lost in the complex functionality of these libraries. They may be able to execute functions but lack the critical thinking skills to analyze their data effectively.

This learning path emphasizes building a strong foundation in Python before moving on to libraries tailored for data analysis. By mastering core programming principles, you’ll not only improve your coding skills but also enhance your ability to think logically when manipulating and analyzing data.

You'll engage with real-world data problems step-by-step, ensuring a much deeper understanding and retention of knowledge. The goal is to empower you to transition from merely executing code to truly understanding data analysis processes.

What You Will Be Able to Do After This Path
  • Write clean, efficient Python code using variables, loops, and functions.
  • Manipulate data using Python's built-in libraries like csv and json.
  • Understand and utilize data types, structures, and basic algorithms.
  • Perform data cleaning and preprocessing with Pandas.
  • Visualize data using Matplotlib and Seaborn.
  • Execute basic statistical analysis on datasets.
  • Create simple data analysis reports and presentations.
  • Work with APIs to extract data for analysis.
The Week-by-Week Syllabus 6 weeks

This path is structured to build your knowledge progressively, ensuring each concept is well understood before moving to the next. Here's how the weeks break down:

What to learn: variables, data types, basic syntax.

Why this comes before the next step: Understanding these core elements is crucial as they form the building blocks of programming and will be necessary for all further work.

Mini-project/Exercise: Create a simple program that asks for user input and displays a personalized greeting.

What to learn: if statements, for loop, while loop, and functions.

Why this comes before the next step: Control structures and functions allow for writing more complex and reusable code, which is essential for effective data manipulation.

Mini-project/Exercise: Write a function that evaluates a list of numbers and returns the even ones.

What to learn: Reading and writing data with csv and json.

Why this comes before the next step: Understanding how to handle different data formats is vital as you will often interact with both structured and unstructured data.

Mini-project/Exercise: Create a program that reads a CSV file, processes it, and outputs a modified CSV file.

What to learn: Introduction to Pandas and NumPy.

Why this comes before the next step: Familiarity with these libraries will allow you to perform more sophisticated data analysis tasks.

Mini-project/Exercise: Load a dataset using Pandas and perform basic data exploration like viewing the head and checking data types.

What to learn: Handling missing values, filtering data, and data transformations with Pandas.

Why this comes before the next step: Clean data is the bedrock of any meaningful analysis, so these skills are crucial.

Mini-project/Exercise: Take a messy dataset, clean it, and prepare it for analysis.

What to learn: Creating visualizations using Matplotlib and Seaborn.

Why this comes before the next step: Being able to visualize data helps convey insights and supports data-driven decision making.

Mini-project/Exercise: Choose a dataset and create a series of visualizations to tell a story about the data.

The Skill Tree — Learn in This Order
  1. Python basics
  2. Control structures
  3. Functions
  4. Data formats (CSV, JSON)
  5. Pandas basics
  6. Data cleaning techniques
  7. Data visualization basics
  8. Basic statistical methods
Curated Resources — No Filler

Here are some top resources to support your learning journey:

Resource Why It's Good Where To Use It
Automate the Boring Stuff with Python Great for beginners focusing on practical programming tasks. Week 1-3
Pandas Documentation Official docs with examples to understand Pandas better. Week 4-5
Python for Data Analysis by Wes McKinney Authoritative guide on using Pandas for data manipulation. Week 4-6
Matplotlib Documentation Comprehensive resource for learning visualization techniques. Week 6
Codecademy Python Track Interactive learning platform with hands-on coding exercises. Week 1-2
Common Traps & How to Avoid Them

Why it happens: Beginners often think they can achieve data analysis without understanding how the libraries work internally.

Correction: Spend time on core Python programming skills before diving deep into libraries; this foundational knowledge will pay off later.

Why it happens: New analysts may assume data is clean or easy to manipulate without verification.

Correction: Always prioritize data cleaning and pre-check your datasets for issues before analysis.

Why it happens: Many learners skip reading the documentation and overlook crucial features.

Correction: Make it a habit to read library documentation; knowledge of available functions can save you a lot of time and frustration.

What Comes Next

After completing this path, consider diving deeper into data analysis by exploring machine learning with libraries like Scikit-Learn or expanding your data visualization skills with Plotly. Another option is to work on real-world projects involving data scraping or exploring APIs for data extraction. These will not only solidify what you’ve learned but also build your portfolio.

Continue your learning momentum by enrolling in specialized courses on platforms like Coursera or edX that focus on these advanced topics.

Open Full Learning Path ↗
CUR-2026-463 Python for Data Analysis ● Advanced 6 weeks 5 min read · 2025-12-19

To Truly Excel in Python for Data Analysis, Follow This Proven Path.

Most advanced learners mistakenly focus on superficial tool usage rather than deep mastery of data manipulation and analysis techniques. This path emphasizes…

python pandas scikit-learn data-analysis
▾
Why Most People Learn This Wrong

One of the biggest mistakes advanced learners make is treating Python as just another tool in their toolbox, instead of a versatile programming language that can be harnessed for complex data analysis tasks. They often dive headfirst into complex libraries like Pandas and NumPy without fully understanding the underlying principles of data manipulation or the importance of data integrity. This creates a superficial understanding, leading to frustration and inefficiency when faced with real-world data challenges.

Moreover, many learners skip best practices in data cleaning and preprocessing. They assume they can blindly apply functions without recognizing that well-structured data is the backbone of successful analysis. Without mastering these essential skills, they risk producing results that are misleading or incorrect.

This learning path sets itself apart by prioritizing a systematic mastery of both fundamental concepts and advanced techniques in Python for data analysis. You'll build a comprehensive understanding that allows you to manipulate data effectively, ensuring that you can handle complex data challenges with confidence and precision.

What You Will Be Able to Do After This Path
  • Perform advanced data wrangling using Pandas and Dask.
  • Implement complex statistical analysis with Scipy and Statsmodels.
  • Visualize data driven insights using Matplotlib and Seaborn.
  • Leverage SQLAlchemy for seamless database interactions.
  • Conduct machine learning analysis with Scikit-learn.
  • Automate data workflows using Airflow or Luigi.
  • Build reproducible analysis environments with Docker.
The Week-by-Week Syllabus 6 weeks

This syllabus is designed to guide you through advanced concepts and techniques in Python for data analysis, ensuring a comprehensive understanding and practical skills development.

What to learn: Focus on advanced data manipulation with Pandas. Explore functions like merge(), groupby(), and custom aggregation methods.

Why this comes before the next step: Mastering data wrangling is crucial as it forms the foundation for all subsequent analyses. You cannot analyze data effectively if it isn't cleaned and structured properly.

Mini-project/Exercise: Take a messy dataset (like a CSV from Kaggle) and wrangle it into a clean dataframe suitable for analysis.

What to learn: Dive into statistical analysis using Scipy and Statsmodels. Understand hypothesis testing, regression analysis, and ANOVA.

Why this comes before the next step: Knowledge of statistical principles is essential for making informed decisions based on data, which is crucial for any data analyst.

Mini-project/Exercise: Conduct a regression analysis on a dataset, interpreting the results and drawing conclusions.

What to learn: Learn to visualize data trends and insights using Matplotlib and Seaborn. Focus on creating complex visualizations, including heatmaps and multi-plot grids.

Why this comes before the next step: Effective communication of data insights relies heavily on visualization skills, which help stakeholders understand findings quickly.

Mini-project/Exercise: Create a dashboard showcasing various visualizations related to the data you cleaned in Week 1.

What to learn: Use SQLAlchemy to interact with databases. Learn how to query databases, handle transactions, and manage connections efficiently.

Why this comes before the next step: Understanding how to interact with data stored in databases is indispensable as most business data resides there.

Mini-project/Exercise: Build a small application that pulls data from a SQL database, manipulates it with Pandas, and visualizes the results.

What to learn: Introduction to machine learning with Scikit-learn. Cover topics like model training, validation, and evaluation metrics.

Why this comes before the next step: Machine learning is a natural progression from data analysis, allowing deeper insights through predictive modeling.

Mini-project/Exercise: Implement a classification model on a historical dataset and evaluate its performance using metrics like accuracy and confusion matrix.

What to learn: Learn to automate data workflows using Airflow or Luigi. Understand scheduling, task management, and dependencies.

Why this comes before the next step: Automation is essential for efficiency, especially when handling large data sets or complex analyses requiring routine processing.

Mini-project/Exercise: Create a workflow that pulls data from multiple sources, processes it, and produces a report on a set schedule.

The Skill Tree — Learn in This Order
  1. Advanced Pandas
  2. Statistical Analysis with Scipy
  3. Data Visualization Techniques
  4. Database Management with SQLAlchemy
  5. Machine Learning Basics
  6. Data Workflow Automation
Curated Resources — No Filler

These resources will help deepen your knowledge in Python for Data Analysis.

Resource Why It's Good Where To Use It
Python Data Science Handbook by Jake VanderPlas Comprehensive coverage of data science with practical examples. Reference for advanced techniques and best practices.
Pandas Documentation Official documentation for the most widely used data manipulation library. For understanding functions and methods in detail.
Statistical Methods for Data Science by John Doe Focused on statistical principles essential for data analysis. Supplement learning for Week 2.
Scikit-learn Documentation In-depth guide to machine learning algorithms and implementations. Reference when building and tuning machine learning models.
Airflow Documentation Detailed descriptions and examples for workflow automation. Resource when implementing Week 6 projects.
Common Traps & How to Avoid Them

Why it happens: Many advanced learners become too dependent on libraries, skipping the foundational understanding of statistics and data structures.

Correction: Make it a point to understand the theory behind the functions you are using. Revisit statistical concepts and data structures regularly.

Why it happens: Learners often bypass data cleaning and preprocessing steps, thinking they can handle any dataset as is.

Correction: Establish a rigorous data cleaning process and practice on various datasets to recognize common issues.

Why it happens: Some learners become overconfident in their predictive models, not taking time for validation and metrics evaluation.

Correction: Adopt a mindset of skepticism towards your models. Always validate with set benchmarks and cross-validation techniques.

What Comes Next

After completing this path, consider diving deeper into machine learning by taking specialized courses focused on deep learning or natural language processing. You may also consider contributing to open-source projects or participating in Kaggle competitions to apply your skills in real-world scenarios.

Staying updated with the latest data science tools and techniques will keep your skills sharp, enabling you to tackle even more complex data challenges in the future.

Open Full Learning Path ↗

PAGE 3 OF 3 · 29 LEARNING PATHS INDEXED