Why Workstations Lose Speed Over Time
Every single week you run your computer, invisible digital debris accumulates under the surface. Temporary caches bloat from normal daily usage, system pathways cross directions, and stealth background applications quietly attach themselves to your startup sequence.
The result? Your hardware isn't old—it's simply crowded. The utility safely unburdens your storage blocks to bring back original click responsiveness.
One-Click Simplicity. No Jargon.
Most operating toolkits on the market are intentionally confusing. They scare users with cryptic alerts or swamp you under endless, risky confirmation checklists. Our development blueprint focuses entirely on clean, background automation.
You do not need to be an administrator or understand complex software settings. Simply click the interface activation handle, let the automated sequence clean the targets, and return immediately to a light, responsive system environment.
Hardware Doctor Pro — Your Complete PC Health Command Centre
Know everything that’s happening inside your PC, in real time, from one beautifully designed application.
Your PC Is Talking. Are You Listening?
Every computer is constantly generating a stream of critical information — temperatures climbing under load, memory filling up, a storage drive showing early signs of wear, a background process quietly consuming more resources than it should. Most of this information goes completely unnoticed, hidden deep inside system menus that are difficult to find, harder to interpret, and spread across half a dozen different utilities.
By the time most users notice something is wrong, the problem has already been building for days, weeks, or months. A drive that was showing warning signs for weeks finally fails and takes irreplaceable data with it. A CPU running too hot throttles performance for months before anyone realises the system is operating below its potential. A rogue process has been consuming memory in the background, and no one knew it was there.
Hardware Doctor Pro was built on a simple but powerful idea: every PC user deserves complete, clear, real-time visibility into what their hardware is doing — presented in a way that’s immediately understandable, without requiring any specialist knowledge to act on.
It’s not just a monitoring tool. It’s a complete hardware intelligence platform for your Windows PC.
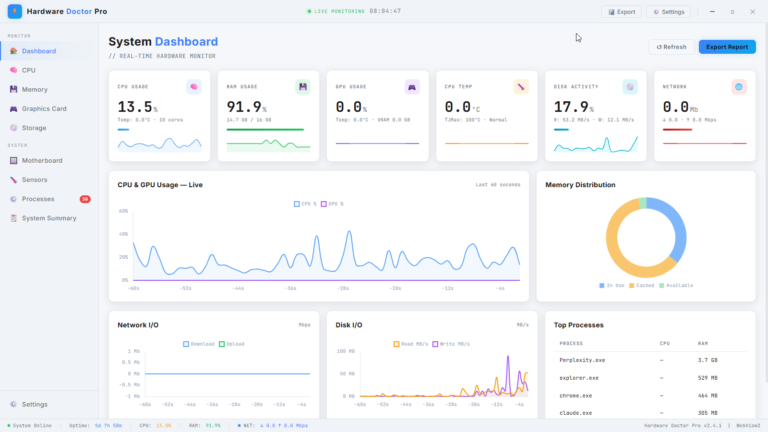
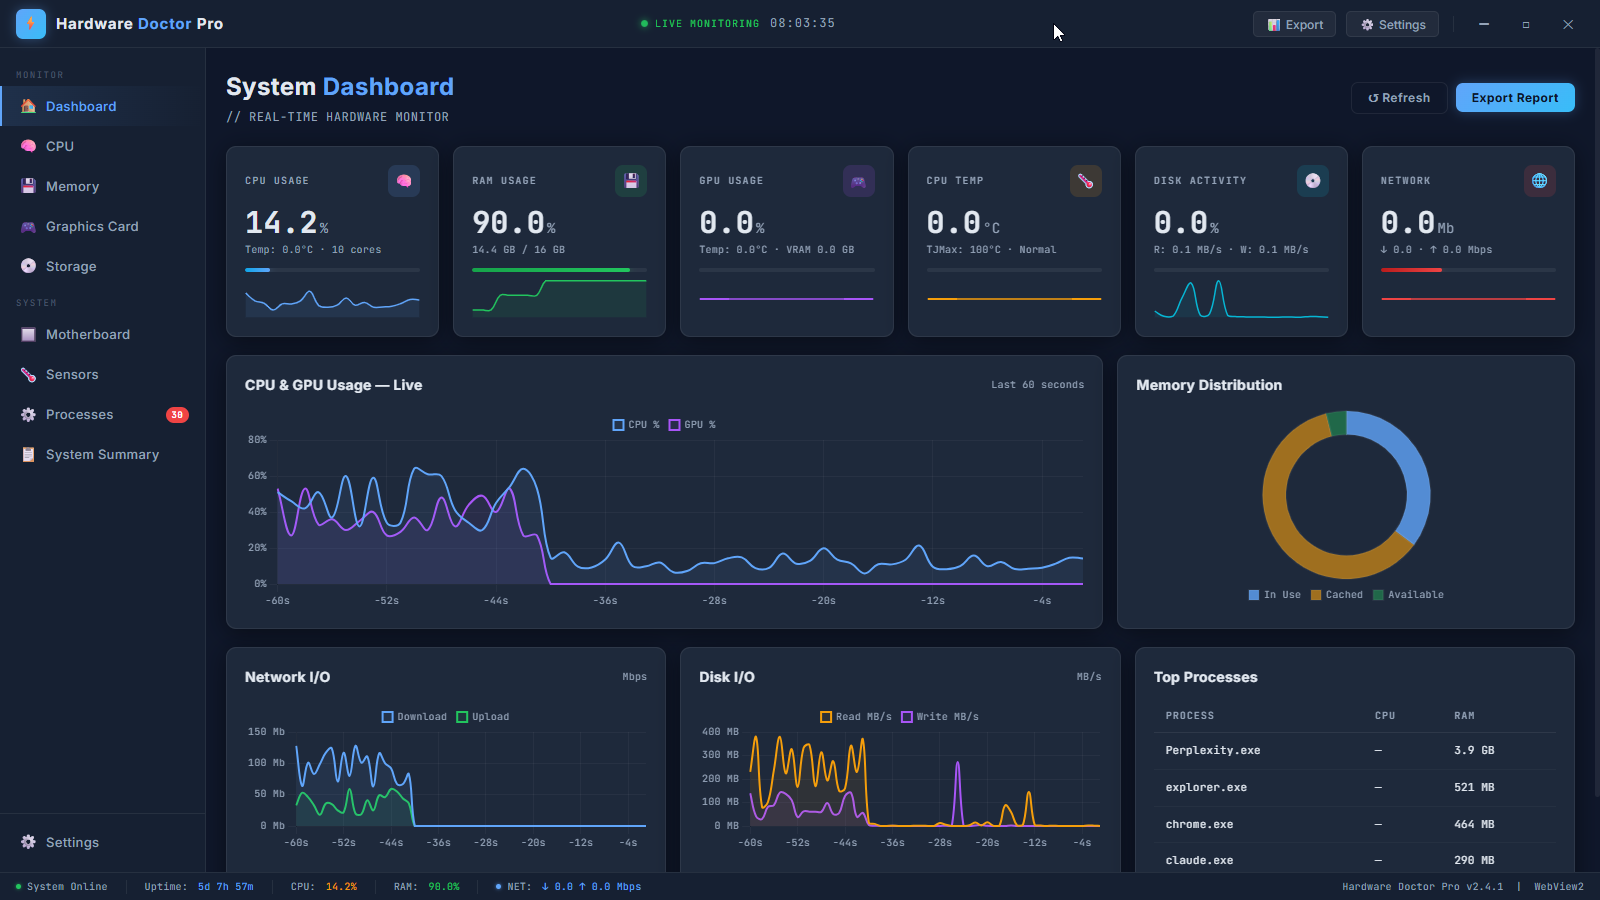
A Dashboard That Tells the Whole Story at a Glance
The moment you open Hardware Doctor Pro, you’re greeted by the System Dashboard — a real-time command centre that puts every critical metric front and centre, updated live as your system operates.
Six key metrics sit prominently across the top of the dashboard, each with its current value displayed in large, readable figures alongside a live sparkline graph showing how that metric has trended over the past minute. CPU usage shows you exactly how hard your processor is working right now. RAM usage gives you a precise breakdown of how much of your memory is in use versus available. GPU usage monitors your graphics card load in real time. CPU temperature keeps you informed about thermal conditions with an immediate visual flag if things are running hot. Disk activity shows live read and write speeds. And Network I/O tracks your current upload and download bandwidth.
Below the summary cards, the dashboard expands into a rich set of live charts. A combined CPU and GPU usage chart plots both metrics simultaneously over the last 60 seconds, giving you an immediate visual sense of how your system is performing over time — perfect for identifying spikes, sustained load, or unusual behaviour patterns.
A Memory Distribution doughnut chart breaks your RAM into three clear segments: in-use memory, cached memory, and available memory — giving you an at-a-glance picture of your memory landscape that’s far more informative than a simple percentage figure.
Network I/O and Disk I/O charts plot real-time read, write, upload, and download activity as scrolling live graphs, so you can see at a glance whether a large transfer is in progress, whether disk activity is unusually high, or whether something is using your network connection unexpectedly.
Finally, a Top Processes panel lists the most resource-hungry applications currently running on your system, with their CPU and RAM consumption displayed side by side. It’s the most important information from Task Manager, presented cleanly and updated continuously — without you having to open anything else.
A prominent Export Report button on the dashboard lets you capture a snapshot of your system’s current state at any moment — invaluable for sharing with a technician, keeping for your own records, or comparing system states before and after a configuration change.
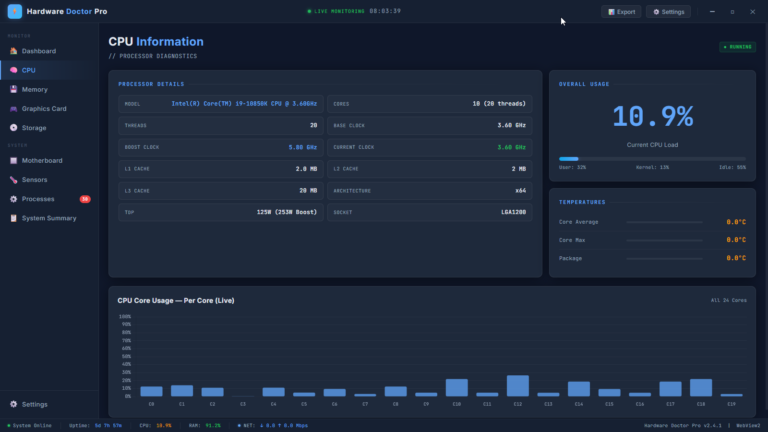
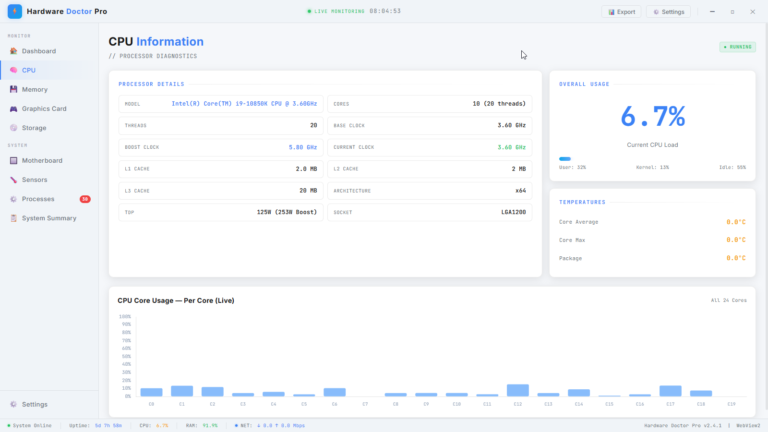
CPU Information — Deep Processor Diagnostics
The CPU section provides a complete picture of your processor — both its static specifications and its live performance state.
Processor Details gives you a comprehensive technical profile of your CPU: model name, core and thread count, base clock speed, boost clock speed, current operating clock, cache sizes across all three levels (L1, L2, and L3), CPU architecture, thermal design power, and socket type. This is the kind of detailed hardware information that previously required specialist utilities or a manual search across multiple websites — now presented cleanly in a single panel.
Alongside the specification panel, a live Overall Usage gauge shows your current CPU load as a large, instantly readable percentage, accompanied by a breakdown of user-mode activity, kernel-mode activity, and idle time — giving you a nuanced picture of what type of work your processor is actually doing.
A Temperatures panel tracks core average temperature, maximum core temperature, and package temperature simultaneously, with colour-coded values that make it immediately obvious whether thermals are within a comfortable range or approaching concerning levels.
And below all of this, a CPU Core Usage — Per Core (Live) bar chart shows the utilisation of every individual core in your processor simultaneously, updated in real time. For multi-core processors — including high core count CPUs with 20 or more cores — this view lets you see exactly how workloads are being distributed across your hardware, identify cores that are being over- or under-utilised, and understand your processor’s behaviour in a way that a single aggregate percentage figure simply cannot convey.
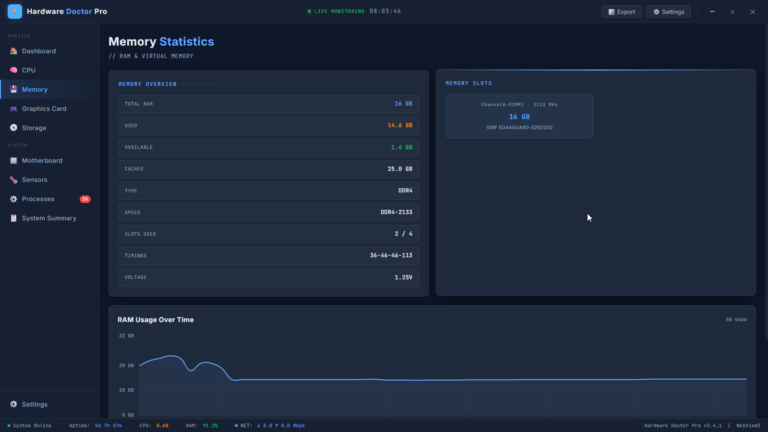
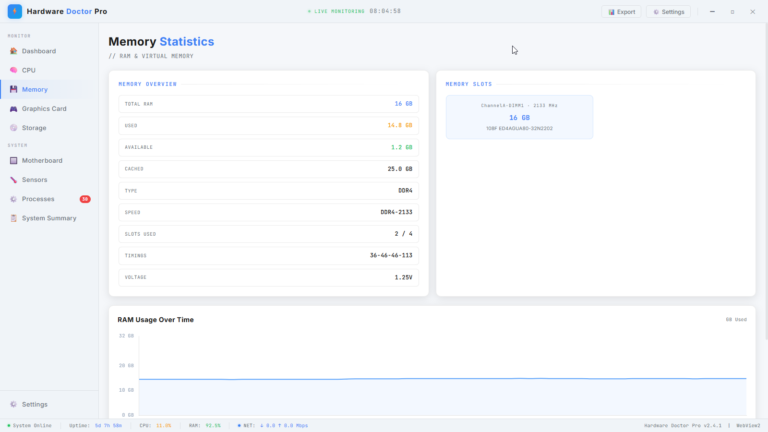
Memory Statistics — RAM and Virtual Memory in Full Detail
The Memory section goes far beyond a simple used/available readout to give you a complete picture of your system’s RAM — both what it’s doing right now and what it’s made of.
The Memory Overview panel covers total installed RAM, currently used memory, available memory, and cached memory — so you can see not just the headline figure but the full breakdown of how your memory is being allocated. Crucially, it also surfaces your RAM’s technical specifications: type (DDR4, DDR5, etc.), speed rating, timing values, voltage, and how many of your available memory slots are currently occupied.
This last detail is particularly useful for anyone considering a RAM upgrade. Knowing you have 2 of 4 slots filled means you have room to expand without replacing existing modules — information that’s genuinely valuable when planning a hardware upgrade.
The Memory Slots panel shows the physical details of each installed memory module, including its channel assignment, capacity, speed, and part number — exactly what you’d need if you were sourcing a matching module to add to your system.
A RAM Usage Over Time chart plots your memory consumption as a scrolling live graph, making it easy to see trends, identify memory leaks in applications that gradually consume more and more RAM over time, and understand your system’s memory behaviour across an extended session.
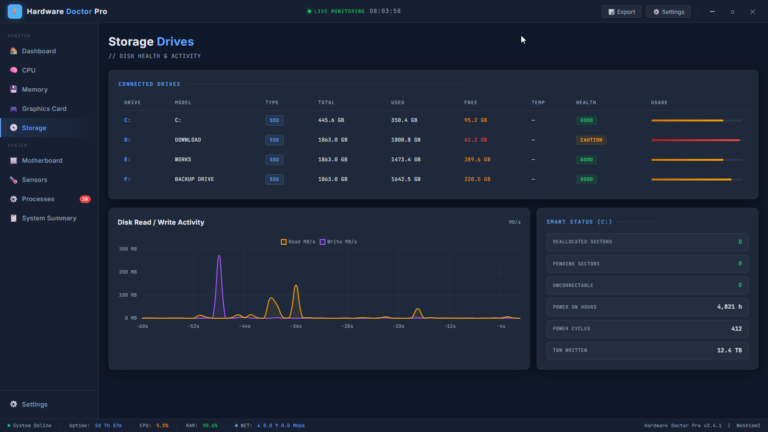
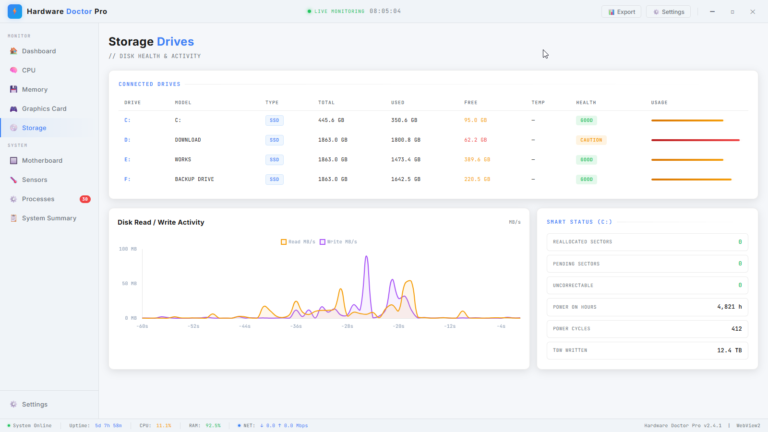
Storage Drives — Disk Health, Activity, and Intelligence
The Storage section provides a unified view of every drive connected to your system — with health status, capacity information, and live activity monitoring all in one place.
The Connected Drives table lists every drive with its drive letter, model name, type (SSD, HDD), total capacity, used space, free space remaining, current temperature, and a colour-coded Health status indicator. A drive in good condition shows clearly. A drive showing signs of concern is flagged with a Caution status — giving you the early warning you need to back up your data before a problem becomes a crisis.
Live Disk Read/Write Activity is plotted as a real-time scrolling chart, showing both read and write speeds simultaneously across the last 60 seconds. This is invaluable for understanding what your drives are doing at any given moment — whether a large file copy is in progress, whether an application is writing unexpectedly large amounts of data, or whether disk activity is the reason your system feels sluggish.
For each drive, Hardware Doctor Pro also surfaces SMART Status data — the self-monitoring intelligence built into modern storage drives. Key SMART metrics including reallocated sectors, pending sectors, uncorrectable errors, total power-on hours, power cycle count, and total terabytes written are all displayed clearly. These figures are the early warning system for drive failure — and having them visible at a glance means you’ll never be caught off guard by a failing drive again.
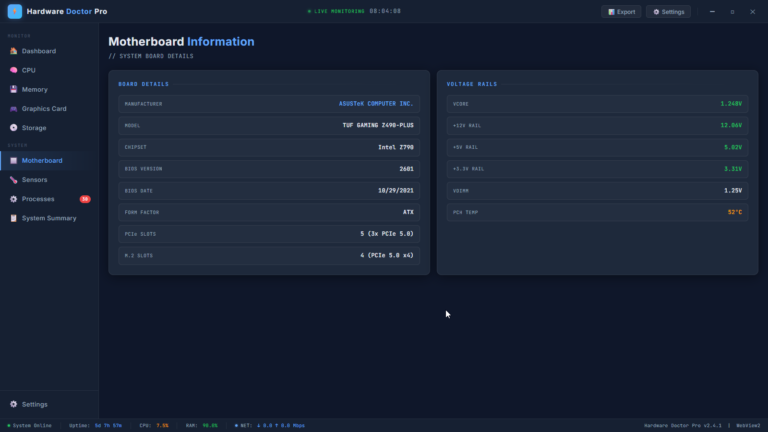
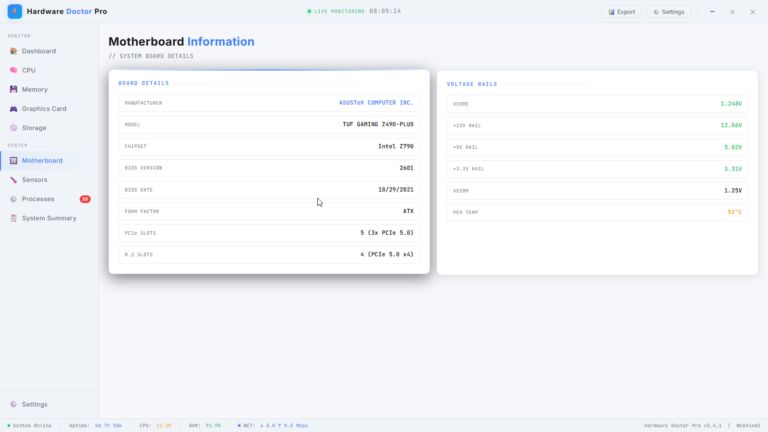
Motherboard Information — The Foundation of Your System
The Motherboard section provides a detailed profile of your system board — the component that connects and powers everything else in your PC, and one that is often the hardest to find information about after a system has been built.
Board Details covers manufacturer, model name, chipset, BIOS version and date, form factor, available PCIe slot count and generation, and M.2 slot specifications. For anyone troubleshooting compatibility issues, planning an upgrade, or simply wanting a complete hardware inventory of their system, this information is genuinely useful and typically requires either opening the PC case or digging through purchase records to find.
The Voltage Rails panel monitors the live electrical voltages being delivered by your power supply across the key rails that power your components — Vcore, +12V, +5V, +3.3V, VDIMM, and PCH temperature. Stable voltages indicate a healthy power supply delivering clean power to your hardware. Fluctuations or out-of-spec readings can be an early indicator of power supply issues — the kind of problem that can damage components if left unaddressed. Having this information continuously visible means you’ll see irregularities long before they cause problems.
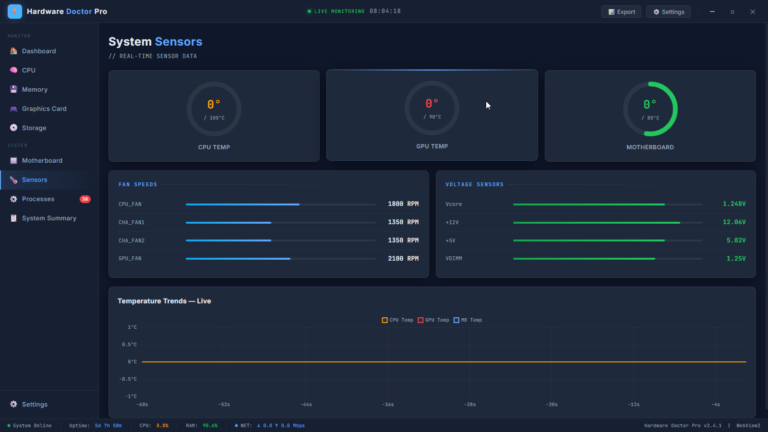
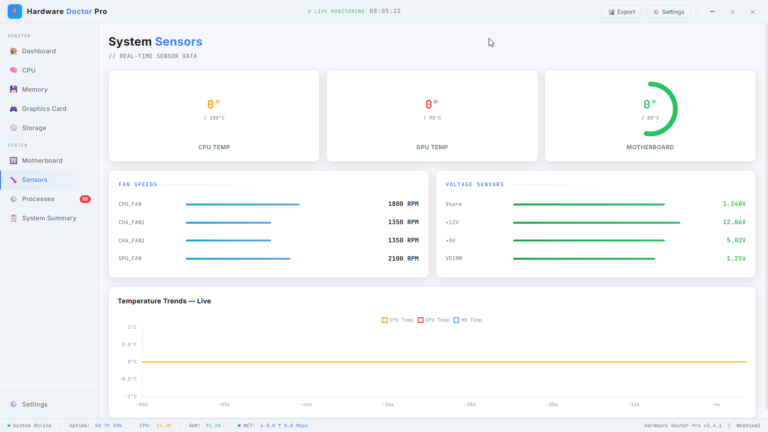
System Sensors — Temperature, Fans, and Voltage at a Glance
The System Sensors section brings together all of your PC’s thermal, cooling, and electrical sensor data in one dedicated view — the most immediate picture of your hardware’s physical wellbeing.
Three large circular gauges display CPU temperature, GPU temperature, and motherboard temperature prominently, each showing the current reading against its maximum safe threshold. The visual design makes it immediately clear how close each component is to its limit — a genuinely useful at-a-glance health check.
The Fan Speeds panel lists every fan in your system — CPU fan, chassis fans, GPU fan — with their current RPM values and a proportional bar indicator. Keeping an eye on fan speeds lets you spot cooling issues early: a fan running slower than expected, a fan that has stopped entirely, or a fan running at maximum speed when it shouldn’t need to.
Voltage Sensors shows live readings for all key voltage rails alongside clear bar indicators, making it easy to see at a glance whether power delivery is stable and within expected ranges.
Below all of this, a Temperature Trends — Live chart plots CPU, GPU, and motherboard temperatures simultaneously as scrolling real-time graphs, so you can observe how your temperatures respond to load over time — particularly useful during gaming, rendering, or any intensive workload where thermal behaviour is a concern.
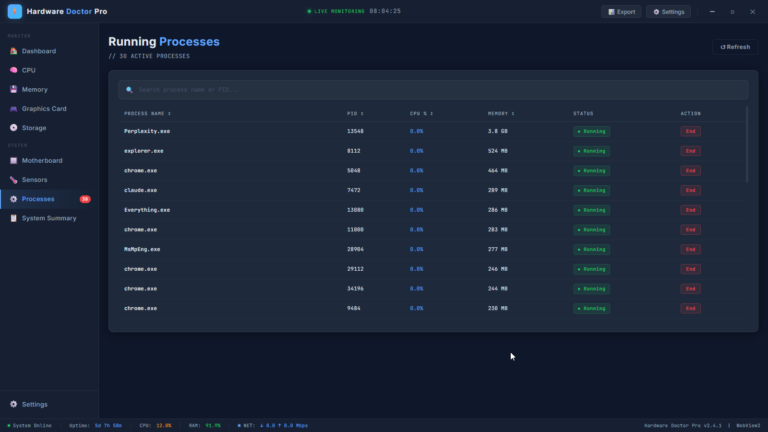
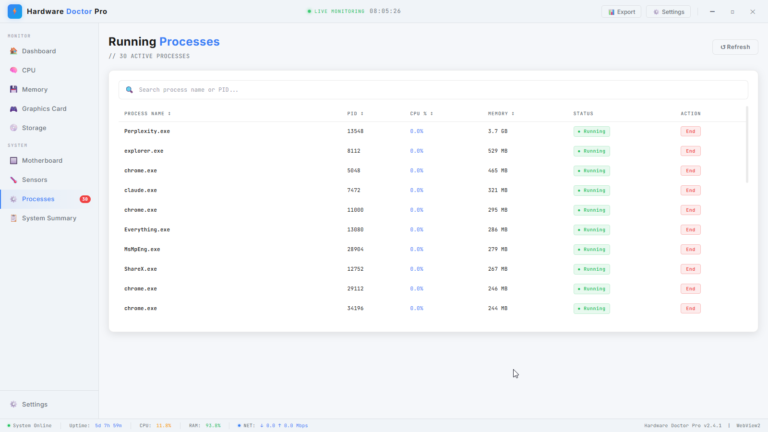
Running Processes — See Everything That’s Active
The Processes section gives you a clear, sortable view of every process currently running on your system — with CPU usage, memory consumption, process ID, and status all displayed together.
A search bar lets you find any process by name or ID instantly. Sortable columns let you rank processes by CPU load or memory usage to immediately identify what’s consuming the most resources. And for any process in the list, a direct End button lets you terminate it without having to switch to another application.
With 30 or more active processes visible at once, this view gives you the kind of process awareness that helps you understand exactly what your system is doing at any given moment — and the tools to act on what you see.
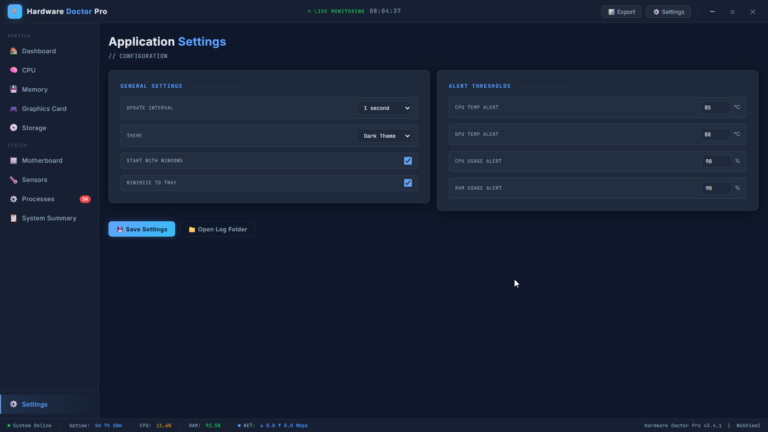
Configurable Alerts — Know Before It Becomes a Problem
One of Hardware Doctor Pro’s most practically valuable features is its configurable Alert Threshold system. Rather than waiting until something goes wrong and then investigating, you can set specific thresholds for key metrics — and Hardware Doctor Pro will alert you the moment any of them are crossed.
CPU temperature alerts, GPU temperature alerts, CPU usage alerts, and RAM usage alerts can all be configured independently to your own preferred thresholds. Whether you want to know the moment your CPU temperature exceeds 85°C, or be notified when RAM usage climbs above 90%, the alert system puts you in control of your own monitoring sensitivity.
Combined with the Start with Windows and Minimize to Tray options, Hardware Doctor Pro can run silently in the background at all times — invisible until it has something important to tell you, and always watching when you’re not.
Export — Your System Data, Whenever You Need It
The built-in Export feature lets you generate a full system report capturing all of your current hardware information and live metrics in a shareable format. Whether you’re documenting your system’s specifications for warranty purposes, sharing diagnostic information with a technician, comparing system states before and after a hardware or software change, or simply maintaining your own records, the export functionality makes it easy to capture a complete hardware snapshot at any time.
Built for Everyone Who Owns a PC
Hardware Doctor Pro has been designed with two audiences in mind simultaneously — and it serves both equally well.
For enthusiasts and power users, it provides the depth of information, the granularity of per-core CPU monitoring, the SMART drive data, the voltage rail readings, and the sensor telemetry that serious hardware watchers need. Everything is there, in detail, continuously updated.
For everyday users who simply want to know their PC is healthy and performing well, the dashboard and colour-coded health indicators make it immediately clear when everything is fine and equally clear when something deserves attention — without requiring any technical knowledge to interpret.
The dark, high-contrast interface is easy to read at any time of day. The live monitoring timestamp in the title bar confirms that data is always current. And the persistent status bar at the bottom of every screen gives you a constant heads-up display of your most critical metrics — CPU load, RAM usage, network activity, and system uptime — no matter which section of the application you’re viewing.
The Bottom Line
Your PC is an investment. The hardware inside it is complex, interconnected, and constantly operating under varying levels of stress. Understanding what it’s doing — and catching the early signs of problems before they become failures — is no longer something that requires specialist knowledge or a collection of separate tools.
Hardware Doctor Pro puts everything in one place. Live. Clear. Actionable.
From the moment you install it, you’ll know more about what’s happening inside your PC than you ever have before — and you’ll have the information you need to keep it running at its best for longer.
Hardware Doctor Pro — Know your hardware. Protect your investment. Own your performance.