Process ++
Real-time process monitoring, service control and startup management for Windows
Process++ gives you full visibility and control over every running process, Windows service and startup item on your PC. The process list updates in real time, showing CPU usage, memory consumption, disk I/O, network activity and process priority for every running application and system process. Click any process for a detailed breakdown including open file handles, loaded DLLs, network connections and parent process. The service manager lists every Windows service with its current state, startup type and description — start, stop, pause and change startup type without opening the Services console. The startup manager shows every program that launches at Windows boot. Process++ also includes a one-click kill for frozen processes and a search by name, PID or path.
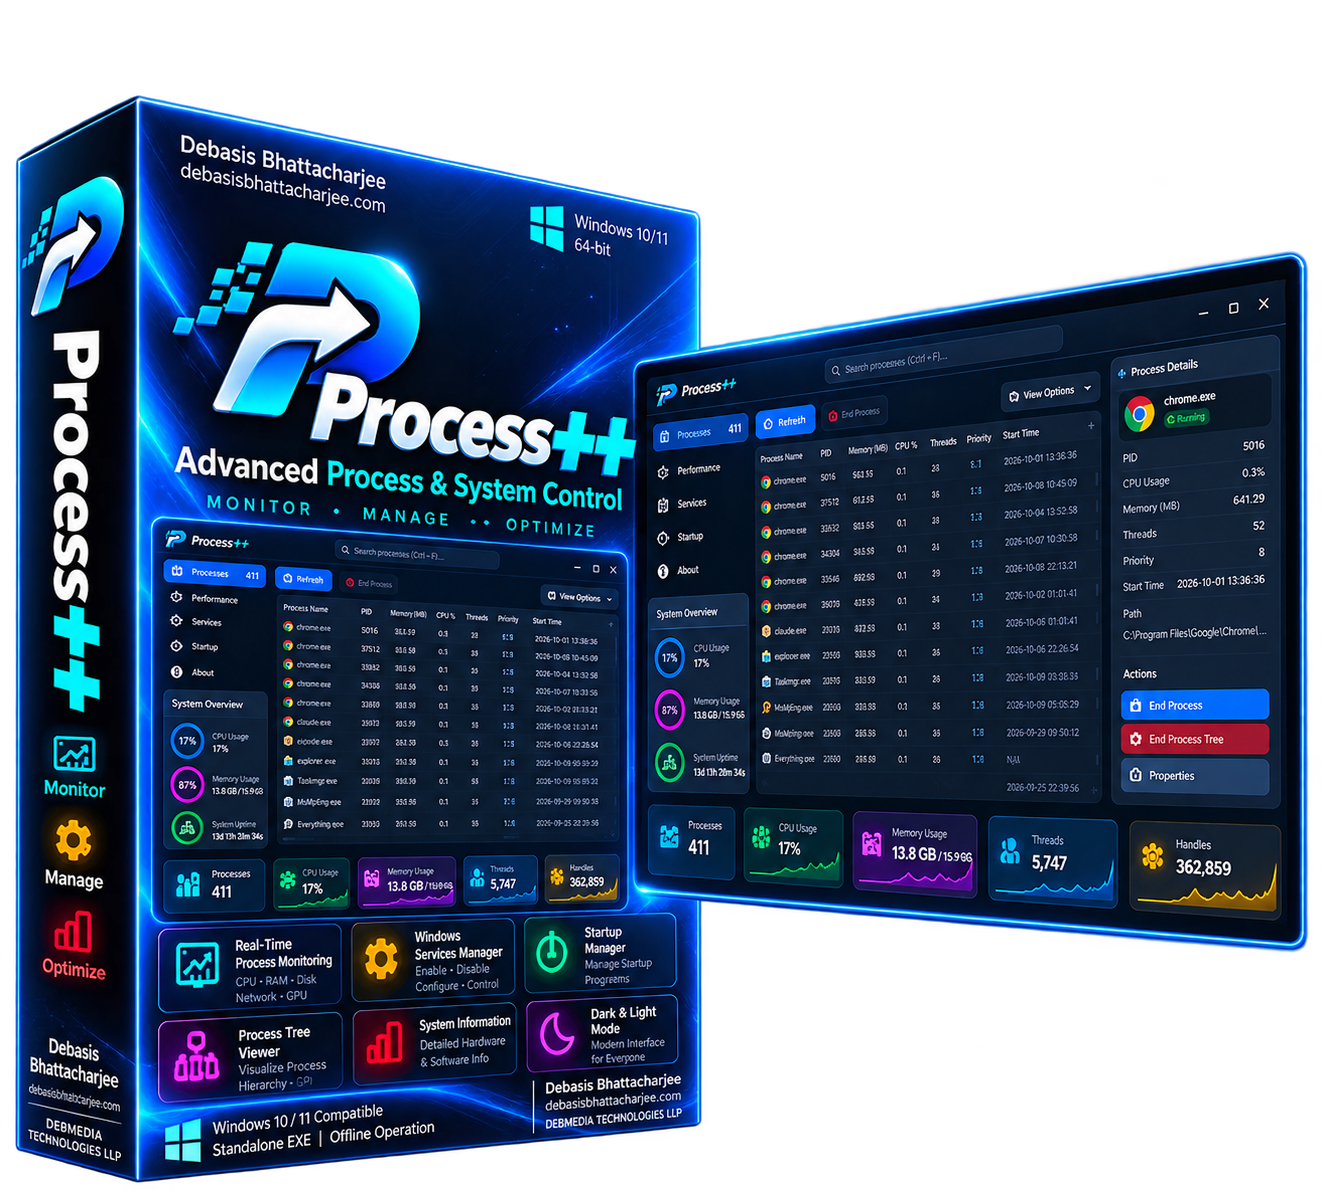
See Process++ in Action
A clean, modern interface designed for real-world use.
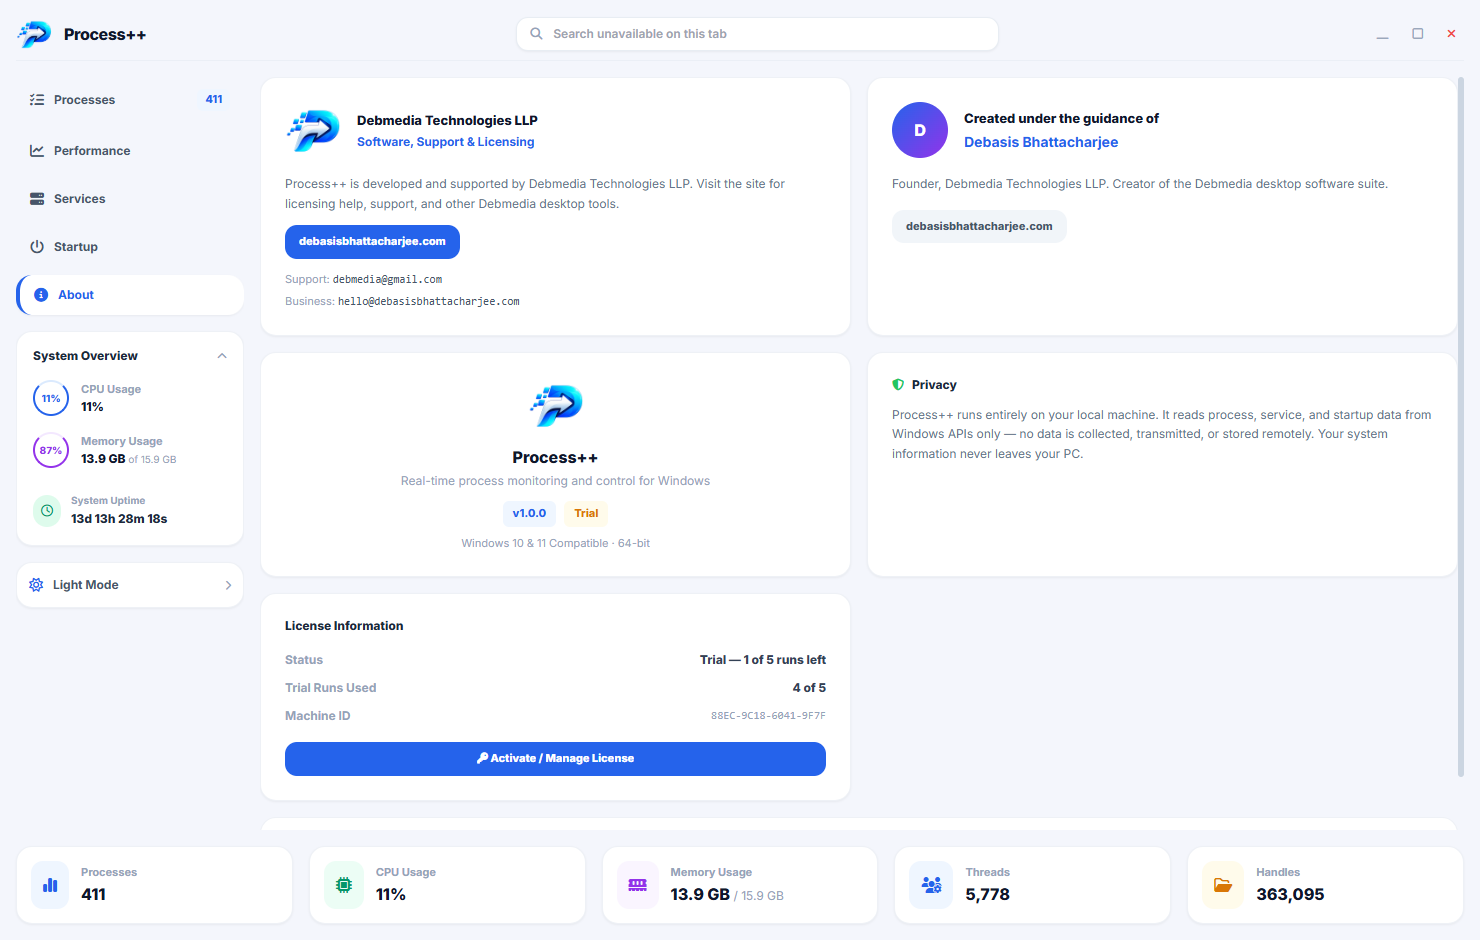
Processplusplus about screenshot
What Is Process++?
Process++ is a Windows process manager and system monitor that gives you deeper, more actionable insight into what is running on your PC than the built-in Task Manager provides. Where Task Manager shows a flat list of processes with CPU and memory columns, Process++ adds per-process disk and network activity, process hierarchy trees (showing which processes launched which), services management, network connections mapped to the responsible process, startup program management, and historical performance graphs — all in a single application designed for both quick diagnostics and extended monitoring sessions.
Process++ is the tool to reach for when a process is misbehaving, something is consuming unexpected resources, or you need to understand the full execution context of what is running on your system.
Screen-by-Screen Feature Walkthrough
1. Main Process List — All Running Processes
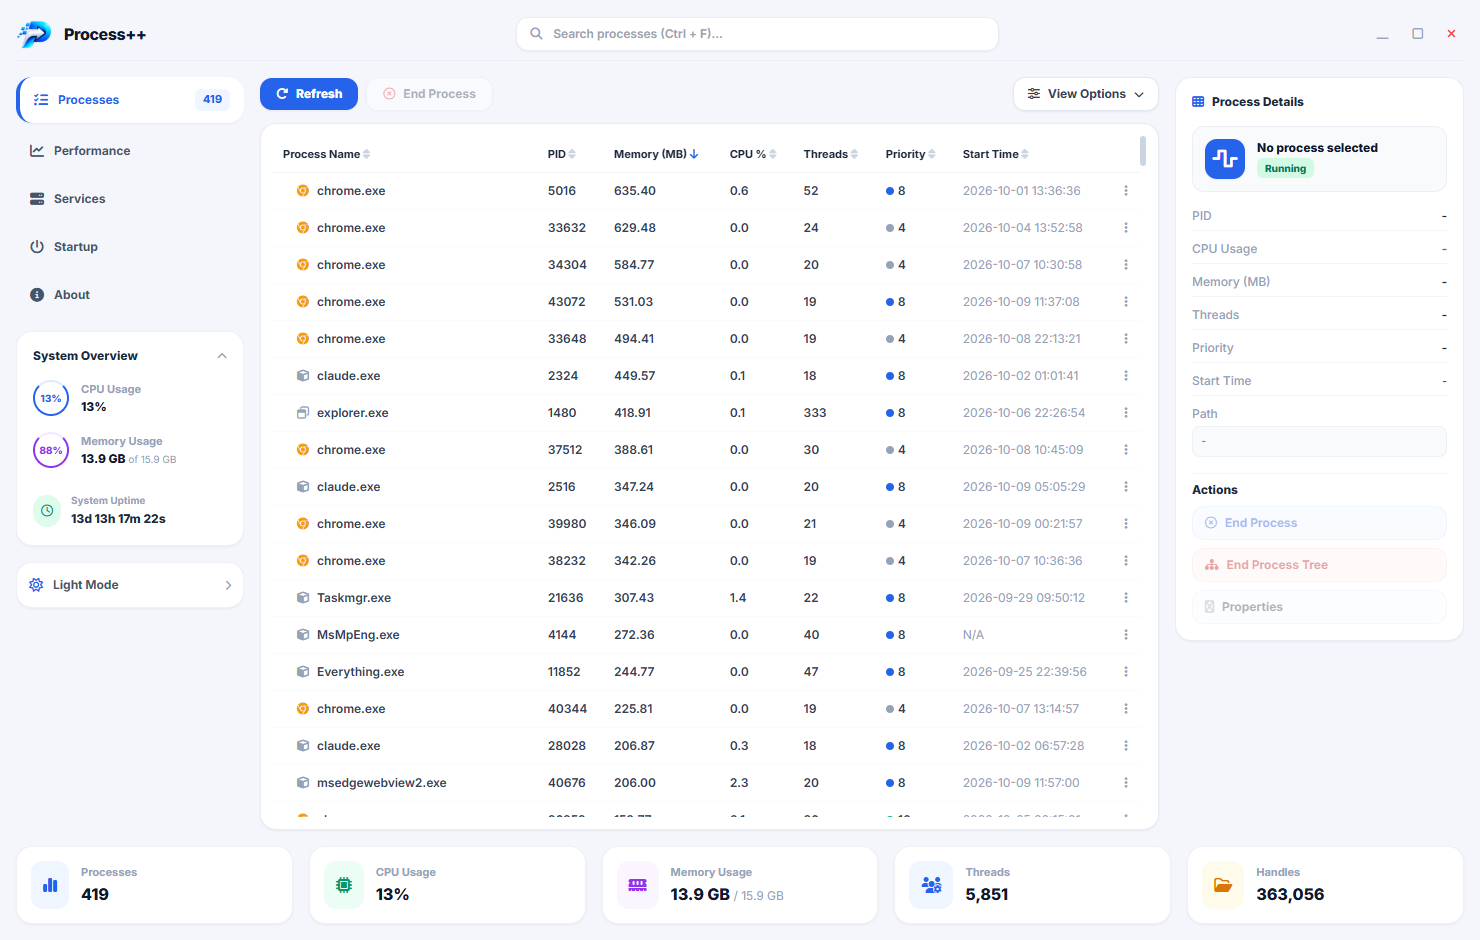
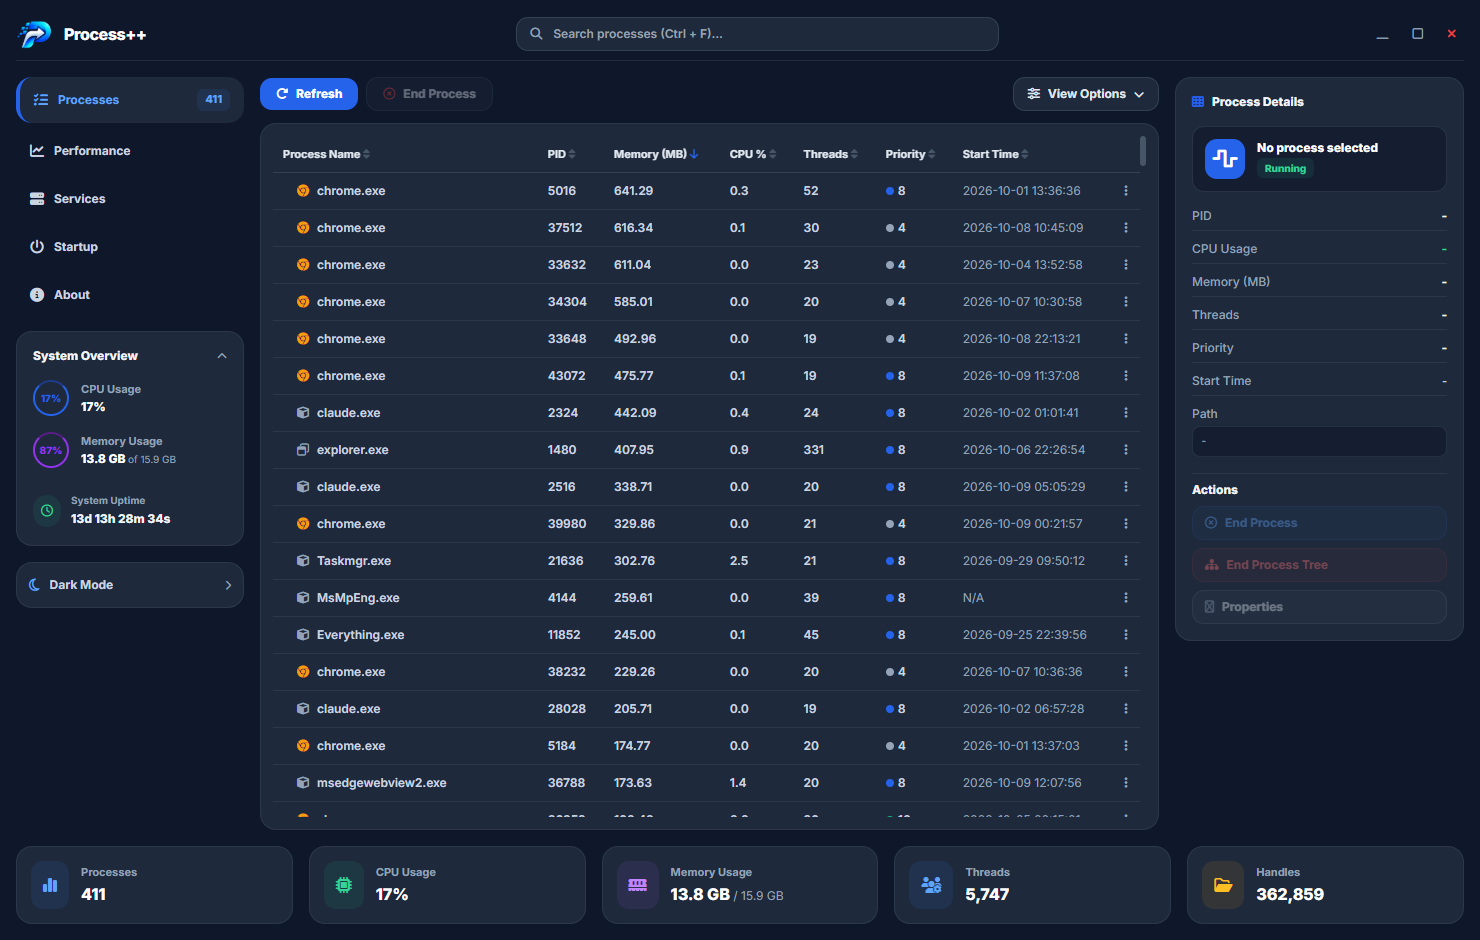
The process list is the starting point for any system investigation. Every running process is listed with its name, PID (Process ID), CPU percentage, memory consumption, disk read/write activity, and network activity — four resource metrics simultaneously, compared to Task Manager which shows CPU and memory but buries disk and network. Clicking any column header sorts the list by that metric, making it immediately clear which process is responsible for high CPU, memory pressure, disk thrashing or unexpected network traffic. The list updates in real time, so a spike in any metric is visible the moment it occurs.
2. Process Details — Deep Inspection of a Single Process
Selecting a process opens its detail view: the full path to the executable on disk, the command-line arguments it was launched with, the parent process that started it, the user account it is running under, start time, and a short history of its CPU and memory usage. The executable path is particularly useful for identifying suspicious processes — legitimate Windows processes always run from specific system directories, and a process with a familiar name running from an unusual location warrants investigation. The command-line view reveals parameters passed to the process at launch, which is often the key to understanding what a process is actually doing.
3. Per-Process Resource Usage
The resource usage view for a selected process shows its current and recent resource consumption across all four metrics: CPU percentage with core-level breakdown on multi-core systems, RAM in megabytes, disk read and write bytes per second, and network bytes sent and received per second. Trend indicators show whether each metric is rising, stable or falling. This four-metric view is the fastest way to answer the question “what exactly is this process doing right now?” — it is complete enough to diagnose most performance issues without needing additional tools.
4. Process Tree — Parent-Child Relationships
The process tree view organises all running processes into their parent-child launch hierarchy. A process that spawns child processes shows them as indented rows beneath it, making it visually clear which executable is ultimately responsible for a group of related processes. This view is essential for understanding complex software — a browser that spawns multiple renderer and helper processes, a development environment that launches build tools and language servers, or a piece of malware that hides its activity inside child processes started from a seemingly innocent parent. The hierarchy reveals relationships that the flat list completely conceals.
5. Services Management
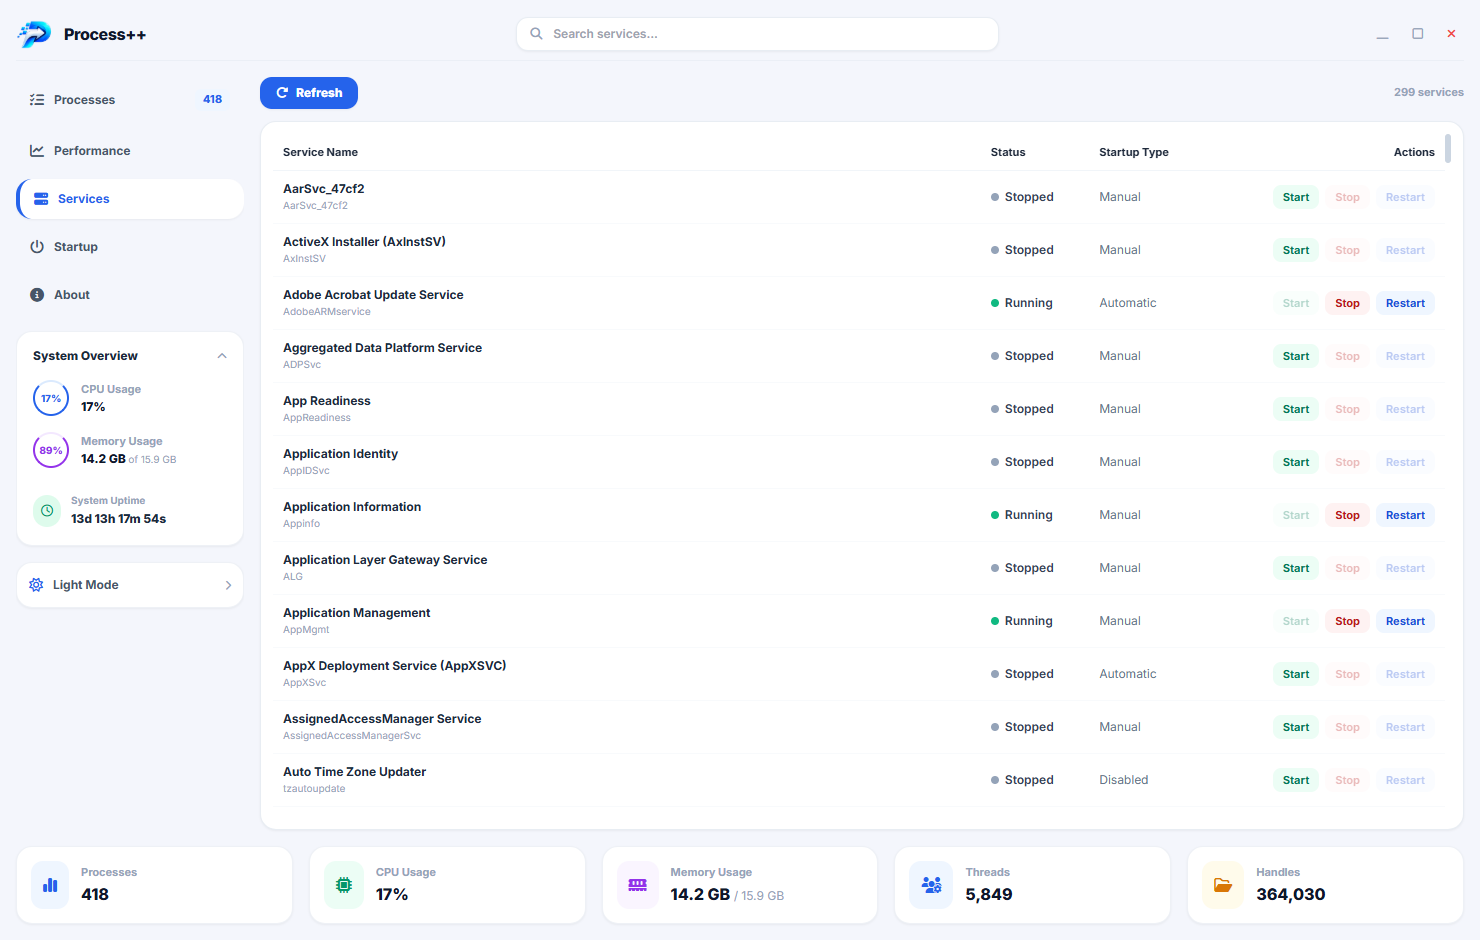
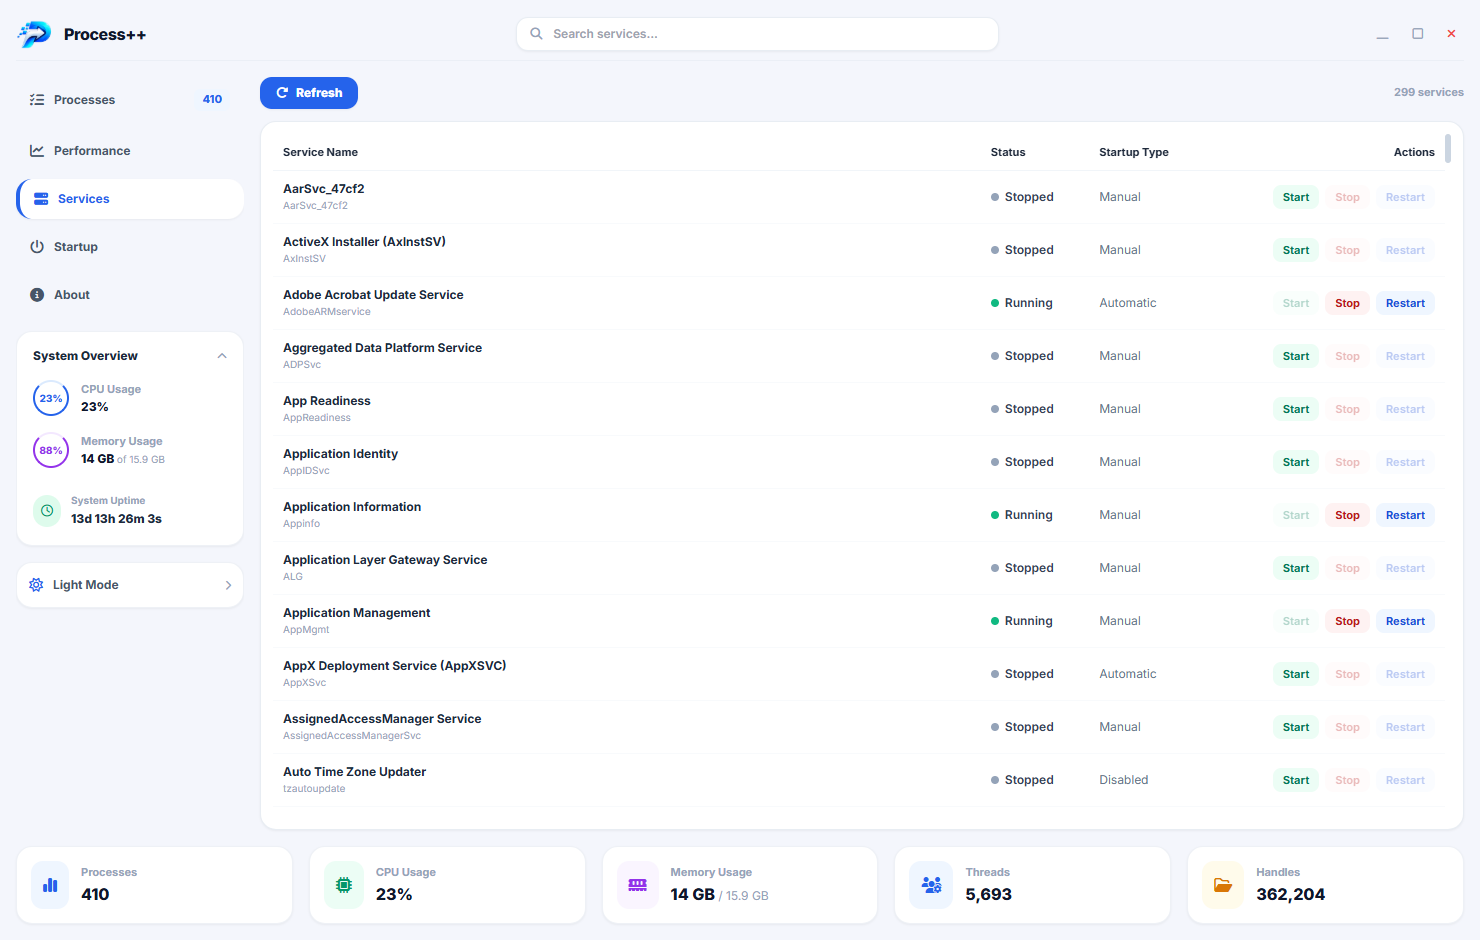
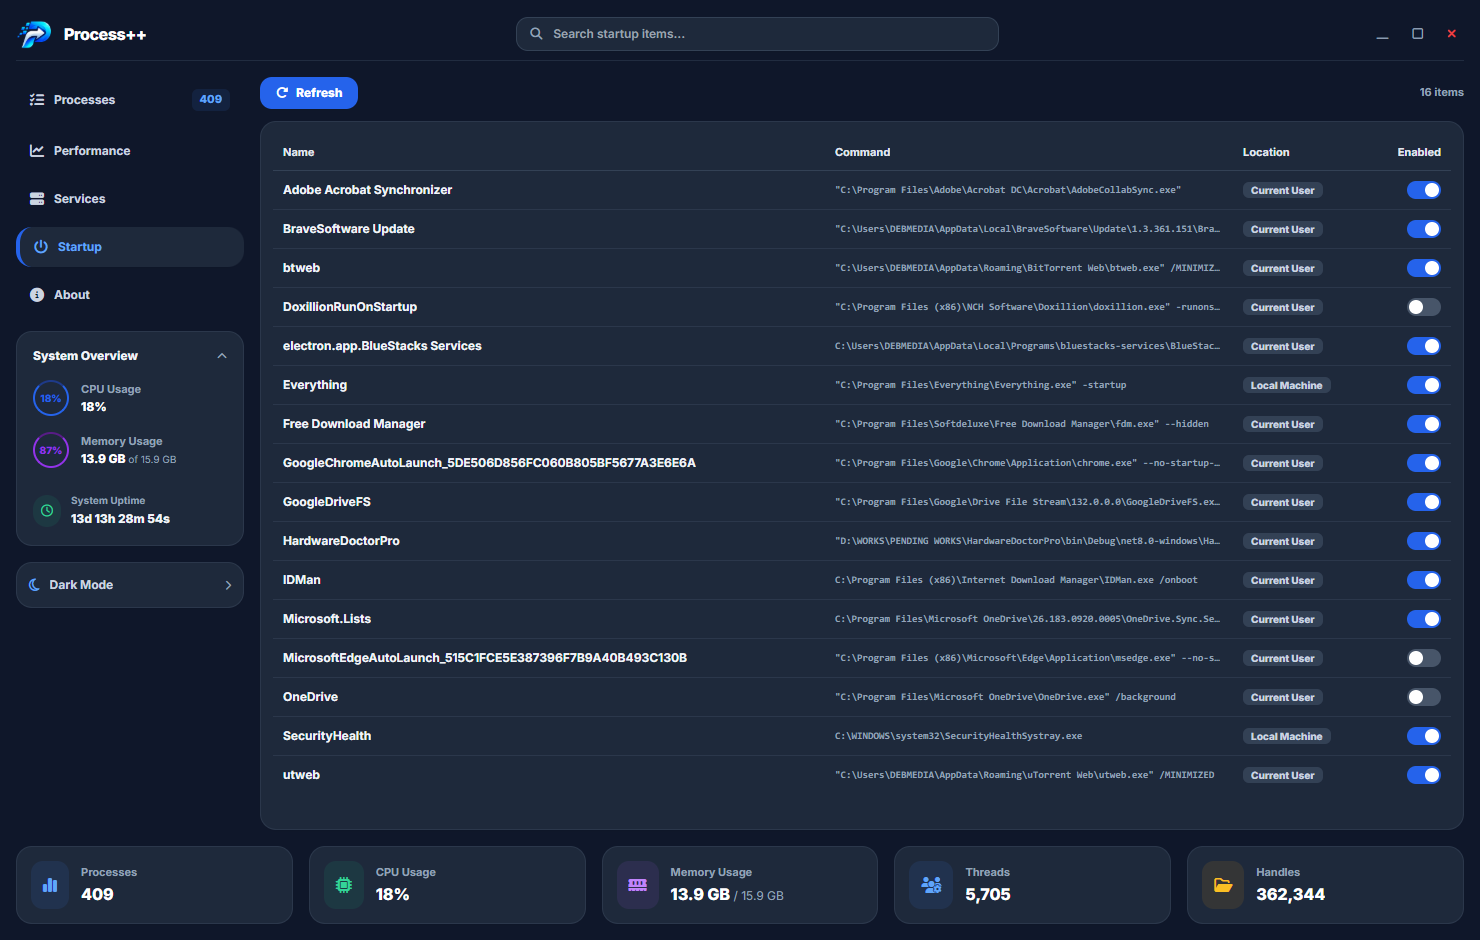
The services tab lists every Windows service registered on the system, showing its display name, service name, current status (Running, Stopped, Paused), startup type (Automatic, Manual, Disabled) and the hosting process name (typically svchost.exe with the specific service group). Start, Stop and Restart controls are available for every service directly from this tab without needing to open the Windows Services management console. For troubleshooting, the services tab quickly reveals which services are running when they should not be, which are stopped when they should be running, and which startup-type services are adding to boot time.
6. Network Connections by Process
The network connections view lists every active TCP and UDP connection on the system, with each connection mapped to the process that owns it. For each connection you can see: the responsible process name and PID, the local address and port, the remote IP address and port, the connection state (ESTABLISHED, TIME_WAIT, LISTENING) and the connection protocol. This view answers the question that Task Manager cannot: “which specific application made this connection to this remote address?” It is the first stop when investigating unexpected network activity, confirming which process is communicating and where it is connecting to.
7. Startup Programs — Boot Performance Management
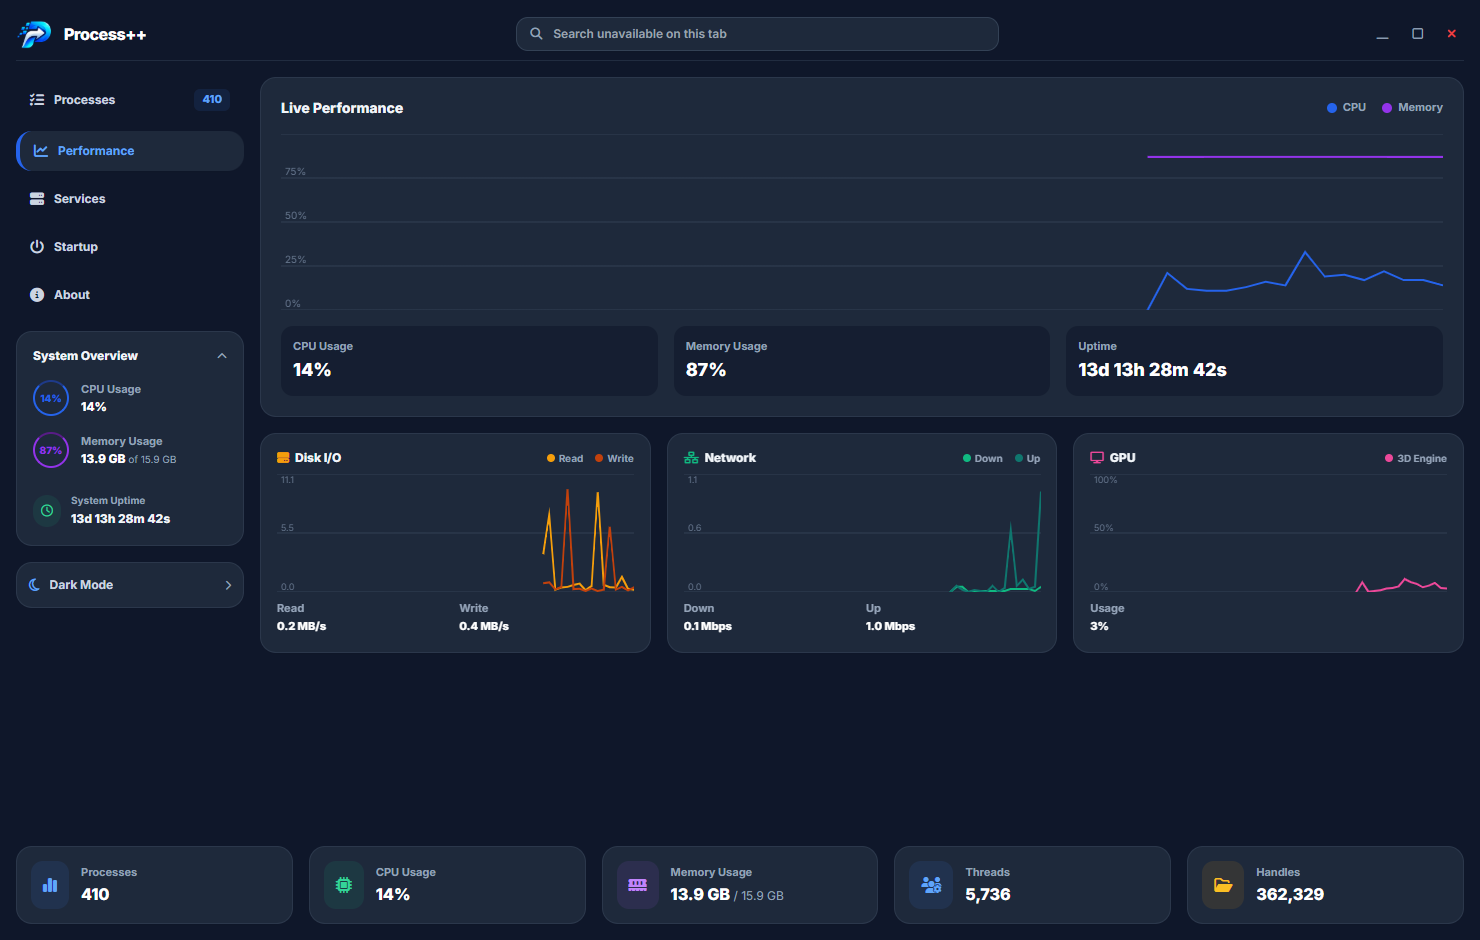
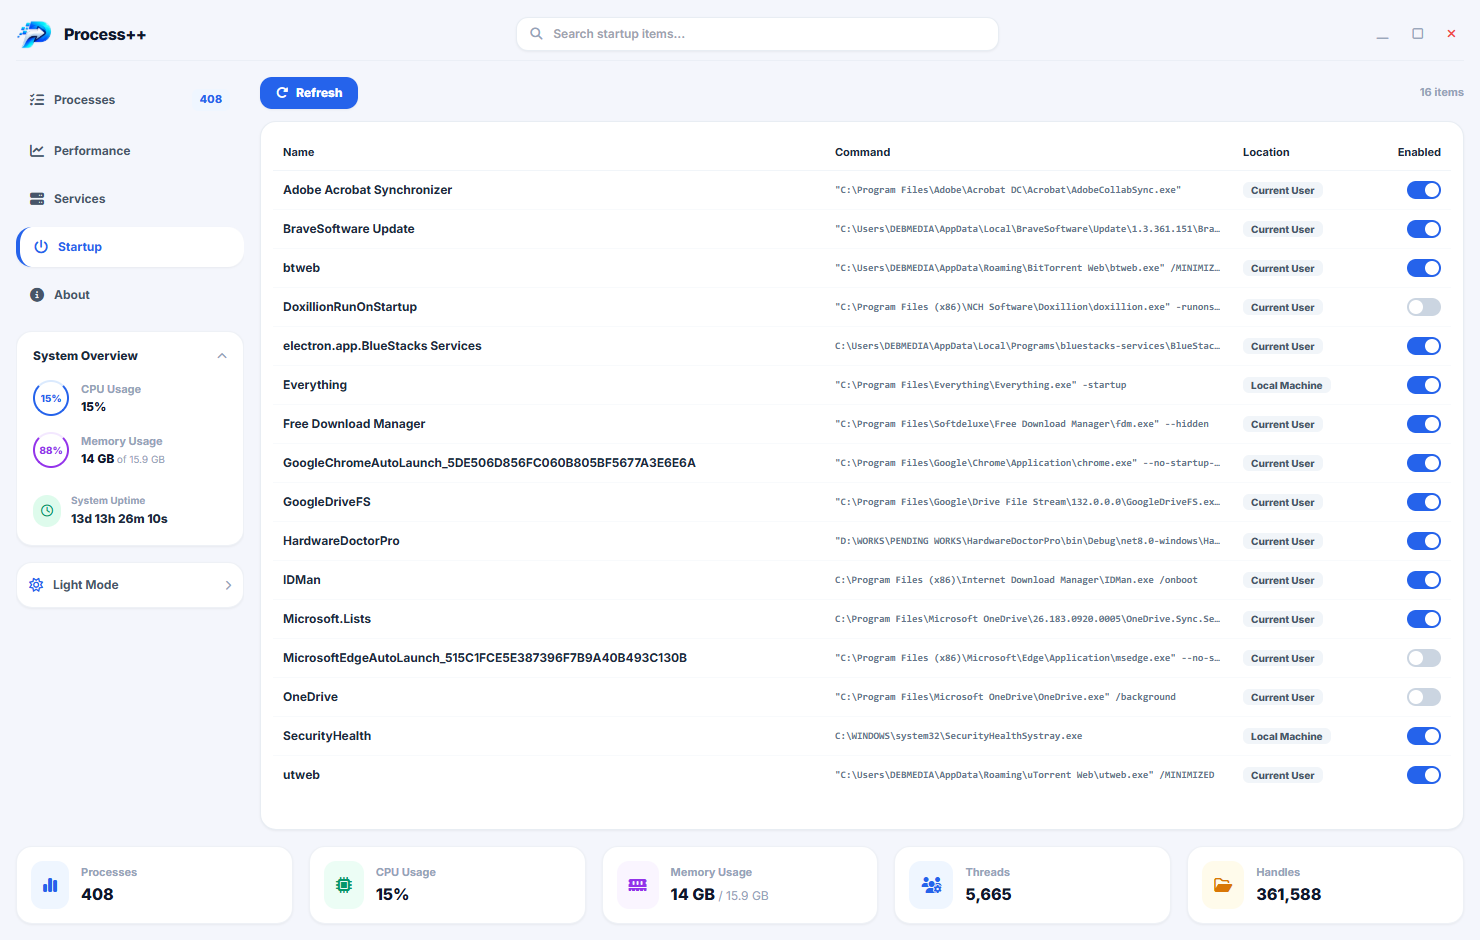
The startup programs view enumerates every application configured to launch automatically when Windows starts — from registry Run keys, the Startup folder, scheduled tasks and other startup mechanisms. For each entry, the application name, executable path, publisher, startup impact estimate and the registry or file system location of the startup entry are shown. Toggle switches enable or disable each startup item without deleting it — disabled items can be re-enabled at any time. Managing startup programs is one of the most effective ways to reduce Windows boot time, and Process++ shows the full picture of what is starting up, including entries that are invisible in the Task Manager Startup tab.
8. Performance History Graphs
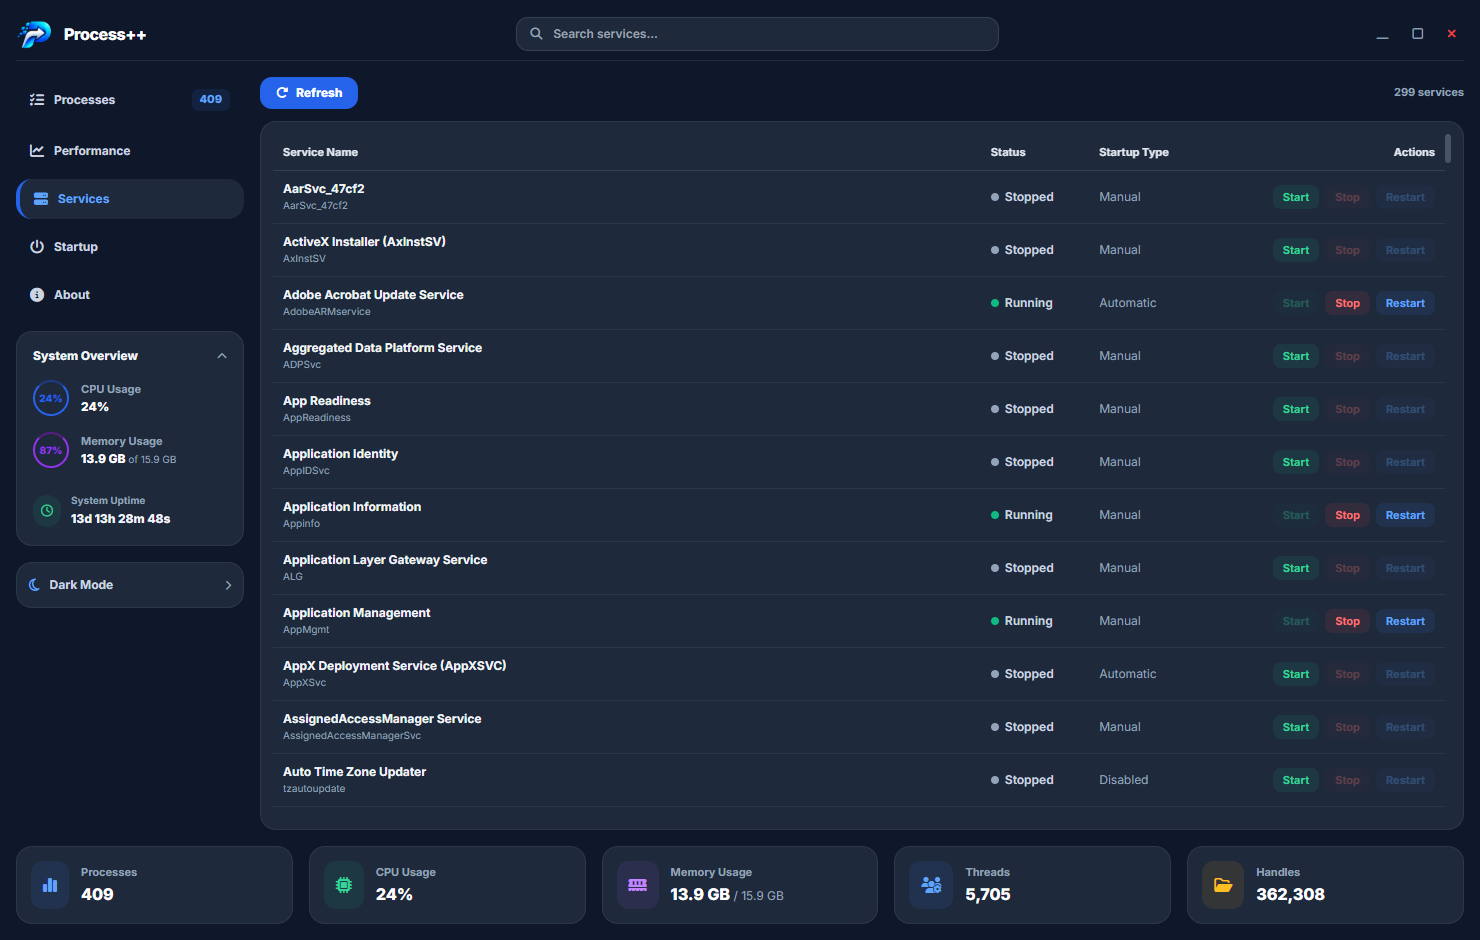
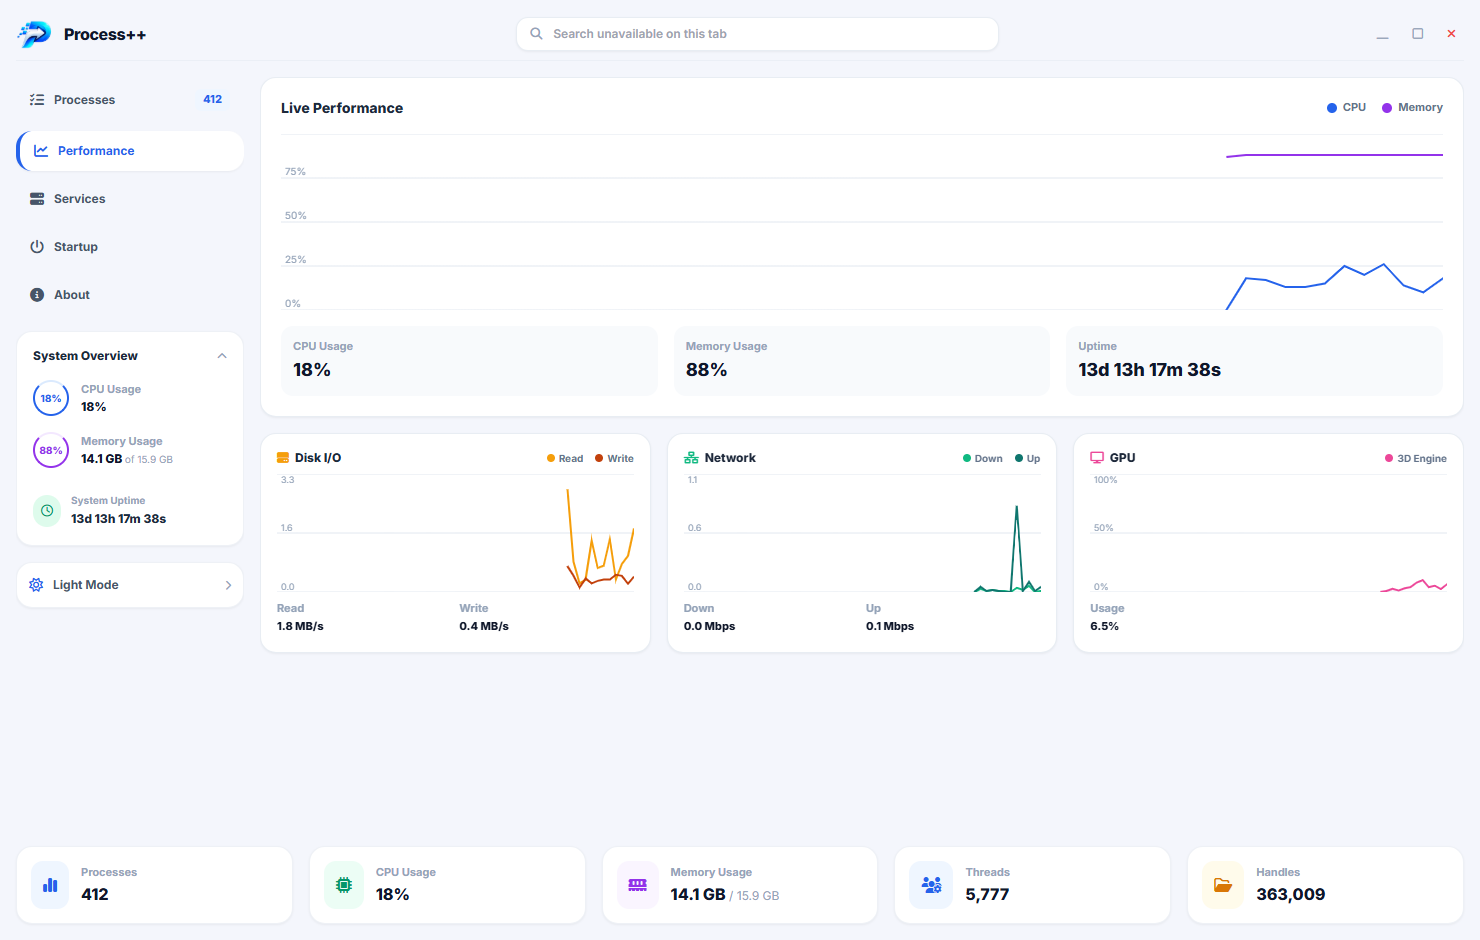
Performance history graphs display CPU, memory, disk and network usage over a rolling time window as continuously updating line graphs. The historical view lets you see activity that has already happened — a CPU spike that occurred two minutes ago while you were away from your desk is visible in the CPU graph even after the spike has subsided. The four graphs are shown together so the relationship between resource types is visible: a CPU spike accompanied by disk activity suggests a process performing a calculation that requires reading data from storage, which is a different diagnosis from a CPU spike with no corresponding disk or network activity.
9. Extended System Monitoring
Beyond the core four metrics, Process++ monitors additional system-level values: GPU utilisation and GPU memory usage, Windows page file usage (indicating memory pressure and virtual memory activity), system handle count and thread count (useful for detecting handle leaks in long-running applications), and GDI object usage. These extended metrics are particularly relevant for power users running GPU-accelerated workloads, developers debugging memory management issues, or anyone trying to understand why a system is degrading in performance over an extended session without an obvious cause in the CPU or RAM metrics.
10. Additional Monitoring and Analysis View
Process++ provides additional analysis views that group and summarise process activity beyond the raw list. Processes can be viewed grouped by application category (browser processes, system processes, user applications), by resource usage tier (high impact, medium, low), or by user account. Summary statistics show aggregate resource consumption across groups, making it easy to see that browser processes collectively account for 30% of RAM even if no single browser process tops the individual rankings. These summary views speed up the “why is my PC slow?” diagnostic from a list-scanning exercise to an immediate category-level answer.
11. About Process++
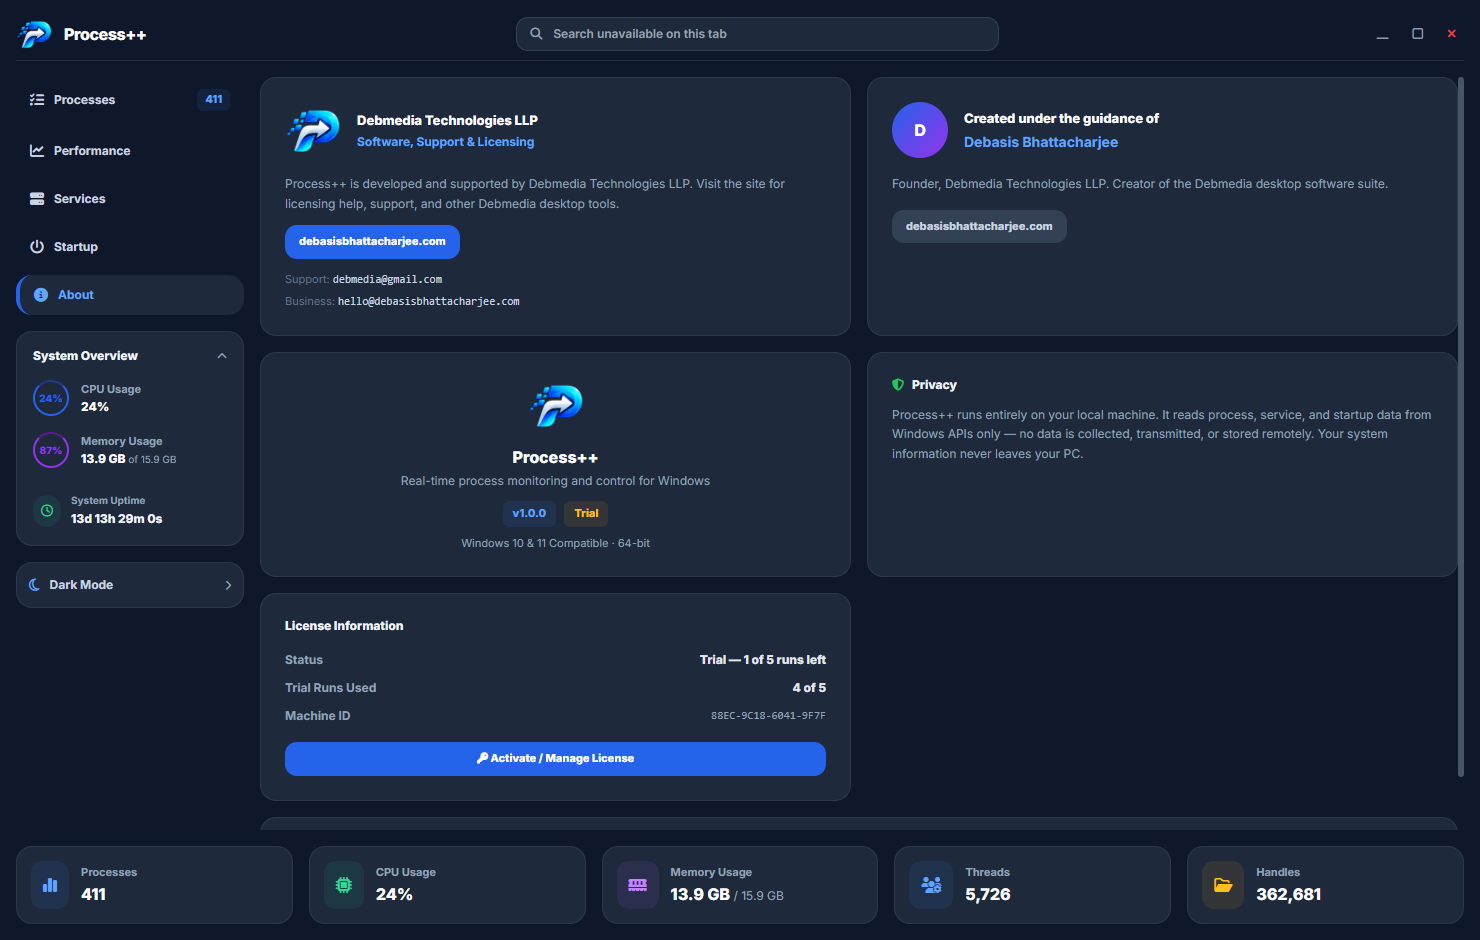
The About dialog identifies Process++ and confirms it is developed and published by Debmedia Technologies LLP, developed by Debasis Bhattacharjee. Version information, contact email and the official website are displayed. The dialog is accessible from the Help menu.
Who Is Process++ For?
- Power users and enthusiasts — Anyone who wants more visibility into what their system is doing than Task Manager provides — complete four-metric resource data, process trees and network connections.
- IT professionals and system administrators — Diagnose performance issues, investigate suspicious processes, manage services and review startup programs across managed machines.
- Developers and QA engineers — Monitor the resource consumption of applications under development, identify memory leaks and handle leaks, and verify that a process is making only the expected network connections.
- Security-conscious users — Network connections by process and full executable path for every running process makes it straightforward to identify unexpected software activity.
- Users troubleshooting slow boot times — The startup programs manager shows every auto-start entry regardless of its location in the registry or file system, with one-click disable controls.
System Requirements
- Operating System: Windows 10 (64-bit) or Windows 11
- Processor: Any modern x64 processor
- RAM: 4 GB minimum
- Storage: 80 MB for the application
- Permissions: Administrator rights recommended for full system visibility and service management
- Display: 1280 × 720 minimum
- Internet: Not required — fully offline
Frequently Asked Questions
Can Process++ terminate processes, including system processes?
Yes. Process++ can end any process for which Windows grants termination permission. Critical system processes that Windows protects cannot be terminated without kernel-level access, which Process++ does not use — this is a safety feature, not a limitation.
Does it monitor GPU usage as well as CPU and RAM?
Yes. Process++ monitors GPU utilisation and GPU memory usage in the extended metrics view and in the performance history graphs. GPU monitoring requires a DirectX 11 compatible GPU with a recent driver that supports the Windows GPU performance counter API.
How does Process++ compare to Sysinternals Process Explorer?
Process++ is designed for Windows 10 and 11 with a modern dark UI, integrated network connections view, startup program management and a performance history dashboard in a single application. It covers the most common process management and diagnostics tasks without requiring administrator rights for basic operation, making it accessible to a wider range of users.
Will it slow down my PC while running in the background?
Process++ is designed for minimal overhead. The process list update frequency can be adjusted from the settings to balance responsiveness against CPU usage when running continuously in the background.
See Everything. Understand Everything. Control Everything.
Task Manager tells you something is using CPU. Process++ tells you which process, what it is doing, where it is connecting, how it got started, and what it has been doing for the last few minutes. That additional context is the difference between a vague symptom and a clear diagnosis.
Whether you are tuning a gaming PC, investigating a suspicious process, managing a work machine or simply satisfying technical curiosity about what Windows is doing under the hood, Process++ gives you the full picture. Download Process++ now — free to try, no account required.
Download Process++
Real-time process monitoring, service control and startup management for Windows