To optimize performance with large datasets in Matplotlib or Seaborn, I would use techniques like downsampling the data, using simpler plot types, and leveraging the `blit` parameter for animations. Additionally,…
Tag
#data-visualization
What techniques can you use to optimize the performance of visualizations created with Matplotlib or Seaborn when handling large datasets?
🏷️
Can you describe a time when you had to visualize complex data using Matplotlib or Seaborn, and how you ensured the visualizations were clear and informative?
In a school project, I visualized a dataset containing student grades and demographics using Seaborn. I created multiple plots to represent different aspects, like box plots for grade distributions and…
🏷️
Can you explain how to create a simple line plot using Matplotlib, and what basic parameters you might use?
To create a simple line plot in Matplotlib, you can use the plt.plot() function. Basic parameters include x and y coordinates to specify the data points, as well as optional…
🏷️
How would you approach designing a data visualization solution that needs to handle real-time data streams and be scalable across multiple users using Matplotlib or Seaborn?
I would implement a system that utilizes a web framework like Flask or FastAPI together with Matplotlib for backend rendering and WebSockets for real-time data updates. This setup allows for…
🏷️
How would you visualize the distribution of a numerical feature in a dataset using Seaborn, and what are the advantages of using a kernel density estimate in addition to a histogram?
To visualize the distribution of a numerical feature, I would use Seaborn’s `sns.histplot()` for the histogram, and overlay `sns.kdeplot()` for the kernel density estimate. The advantage of using a KDE…
🏷️
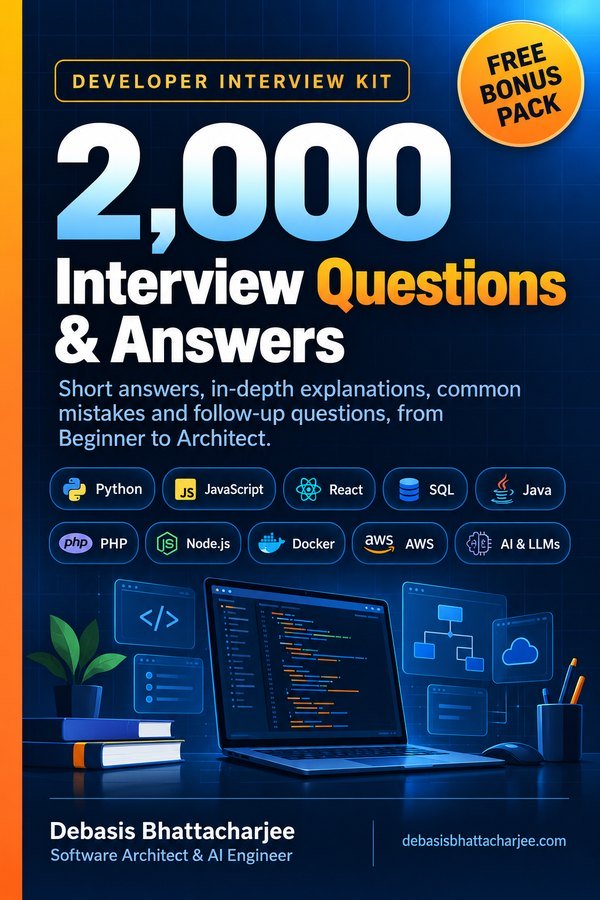
Developer Interview Kit · PDF

2,000 Interview Questions & Answers, in one PDF
- Short answers, in-depth explanations, common mistakes and follow-ups
- 89 topics, from Beginner to Architect, with a clickable contents list
- 226 extra questions that are not on this website
- Free Bonus Pack: 30-day study plan, behavioral questions, salary scripts
$7.99 one-time · instant email delivery
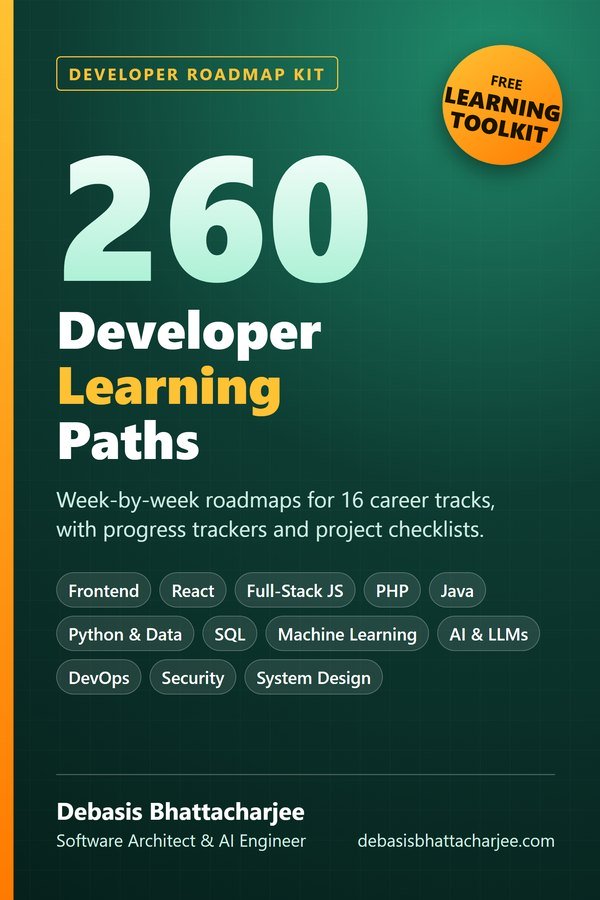
Also available: 260 Developer Learning Paths $4.99
Week-by-week roadmaps for 16 career tracks (Python, React, Java, DevOps, SQL, AI and more), with a progress tracker on every path.
See what's inside →
Get both books for $9.99 (save $2.99):
The material stays free to read online. This is the organised, offline, print-ready PDF edition. Secure payment by PayPal; your personal download link is emailed after payment is confirmed. Digital product, no shipping.